Horner APG SmartStack I/O HE800PBS600/HEPBS600 User Manual
Page 59

CH9: Diagnostics
MAN0575-04-EN
PAGE 59 of 97
© Horner APG.This drawing is the property of Horner APG. And shall not be disclosed or reproduced except as specifically authorised.
Profibus Modules User Manual
EO 09-0009
.
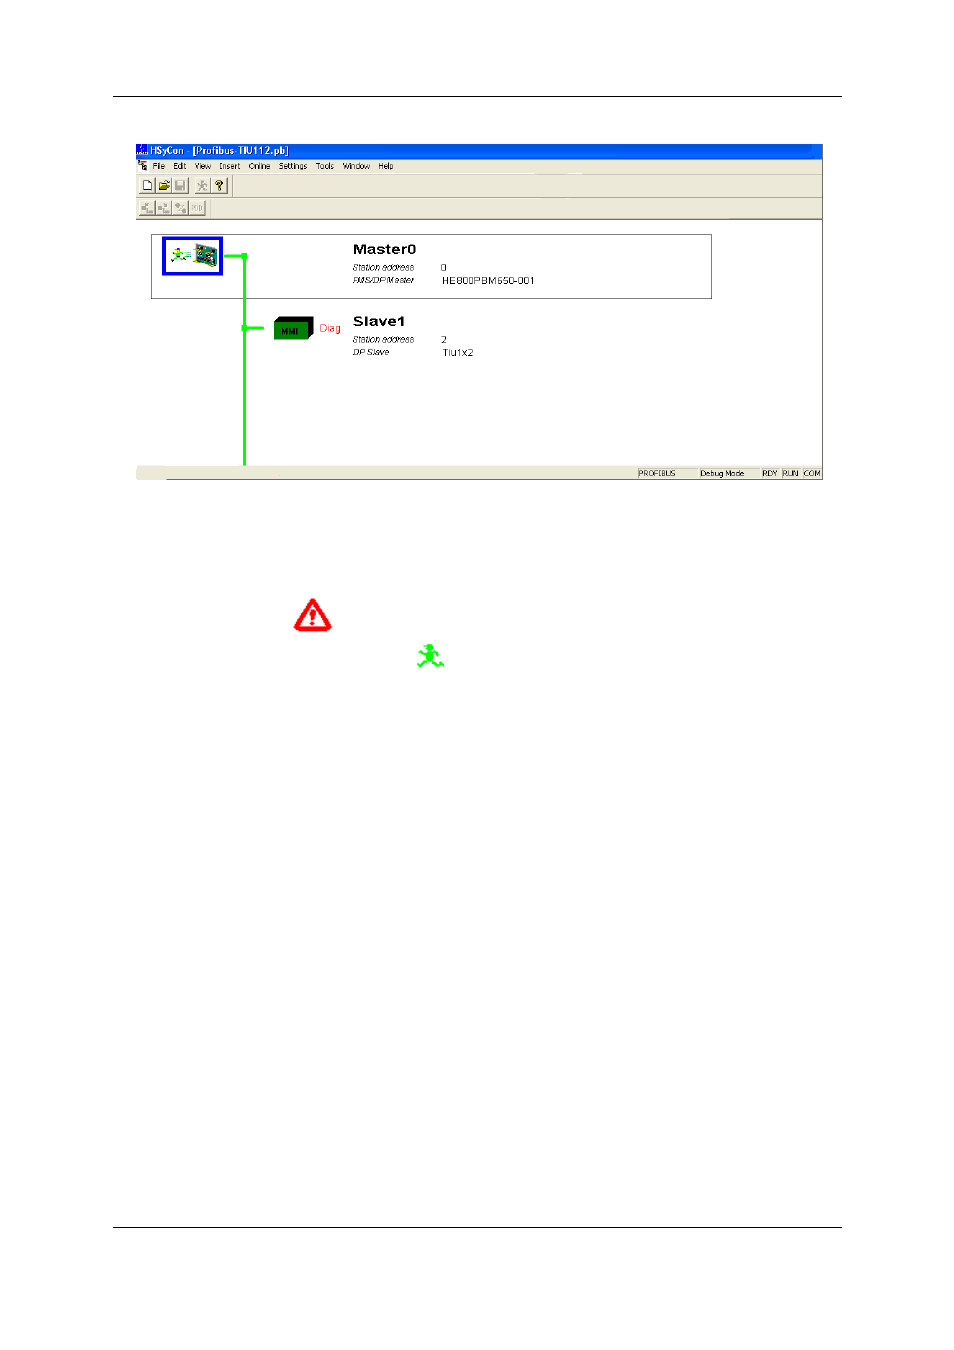
Figure 46: The Debug Window
If diagnostic information is available for a specific device, the text Diag appears in red next to the
device icon. To get further device specific diagnostic information then double-click on the device itself
or set the focus to the device and select Online > Device Diagnostic.
The Master icon has the
sign to show the stop mode.
In run mode the Master icon has the sign
.
9.3
PROFIBUS DP Device Diagnostic
To activate the Debug Mode select the menu Online > Start Debug Mode. Then, mark a Slave (left
mouse click) and then the menu Online > Device Diagnostic to open the diagnostic window for this
Slave. Alternatively, double click on the symbol of the device to open this window. To end the Debug
Mode select the menu Online > Stop Debug Mode.
After the debugger has started HSyCon requests the state of all devices from the Master. If there is
an error on a device, the bus line to this Slave is displayed in red, otherwise it is green. HSyCon also
displays the letters Diag, if the device signals diagnostic information or the master holds diagnostic
information in its internal diagnostic buffer. This information is displayed in more detail if the
corresponding device in Debug Mode is selected with the mouse.
The diagnostic information of a DP Slave can be 6 to 100 (max. 244) bytes. The first 6 bytes are
standard diagnostic information (specification). The meaning of these 6 bytes is according to the
PROFIBUS specification and contains the Station Status 1, 2 , 3, the assigned master address and
the ident number of the Slave.
