Control limits – HEIDENHAIN ND 287 User Manual User Manual
Page 54

54
I Working with the ND 287 position display unit
I – 5 Ser
ies of measur
ements and statistical
pr
ocess
c
ontr
ol
Control limits
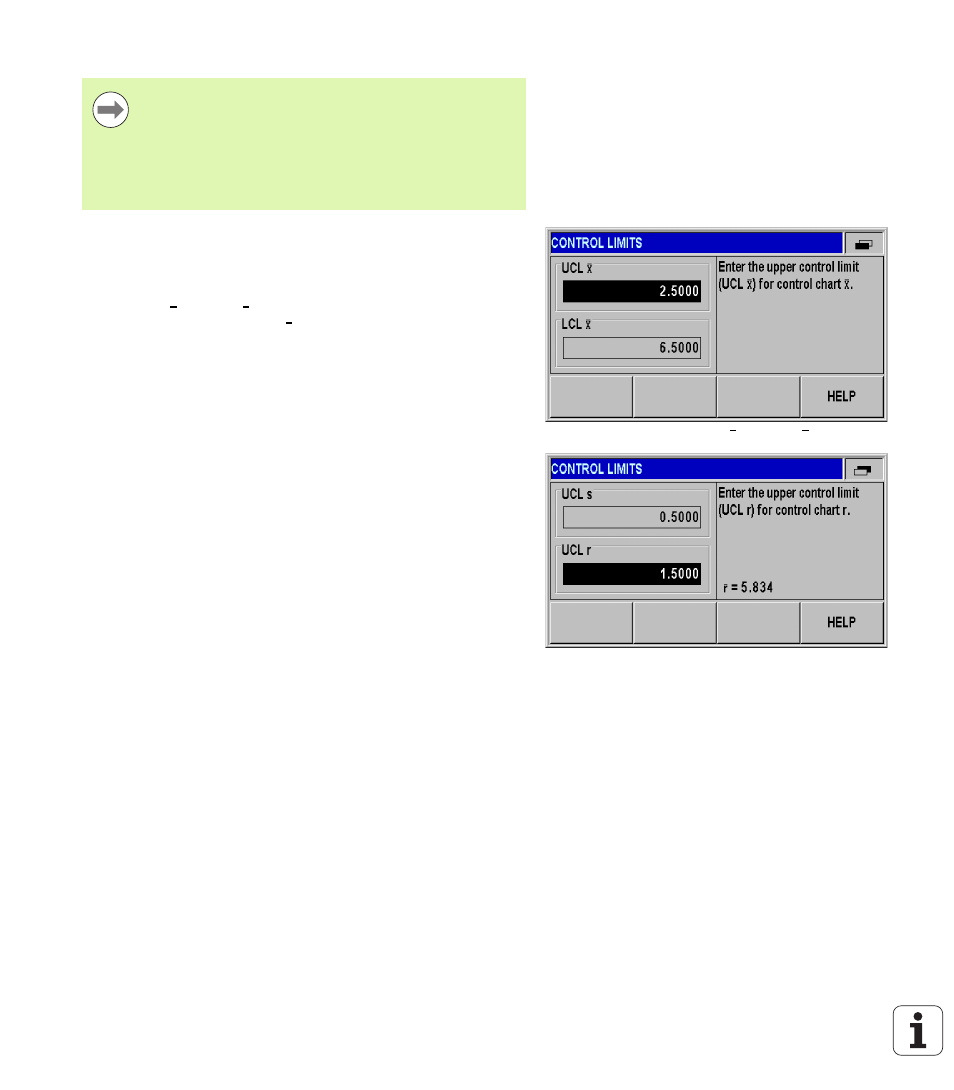
In the CONTROL LIMITS form, you define the control limits for the
control charts.
In the SPC SETUP submenu, select CONTROL LIMITS and press
the ENTER key to open the form.
In the UCL and LCL fields, enter the values of the upper and
lower control limits for the
chart using the numeric keys.
In the UCL s field, enter the value for the upper control limit for
the chart s
using the numeric keys.
In the UCL r field, enter the value for the upper control limit for the
chart r
using the numeric keys.
Press ENTER to confirm your entry.
Incorrect control limits may increase the statistical
spread of the process!
If the measured value falls below or exceeds the control
limits during statistical process control, the ND 287
displays a warning and switches the display to the
respective control chart. The ND does not stop data
acquisition.
Fig. I.59 Control limits UCL and LCL
Fig. I.60 Control limits UCLs and UCL r
x
x
x
x
x
