Calling the spc menu, Spc analysis, Calling the spc menu spc analysis – HEIDENHAIN ND 287 User Manual User Manual
Page 49
ND 287
49
I – 5 Ser
ies of measur
ements and statistical
pr
ocess
c
ontr
ol
Calling the SPC menu
All parameters required for Statistical Process Control (SPC) and the
possibility of analyzing the current or completed SPC are provided by
the SPC menu.
To call the SPC menu, press the SPC [MEAS. SERIES] soft key in the
first soft-key row of the standard screen.
Use the SPC ANALYSIS, SPC SETUP and DELETE STATISTIC
parameters to define further settings.
In the following sections you will find more detailed information on the
menu parameters.
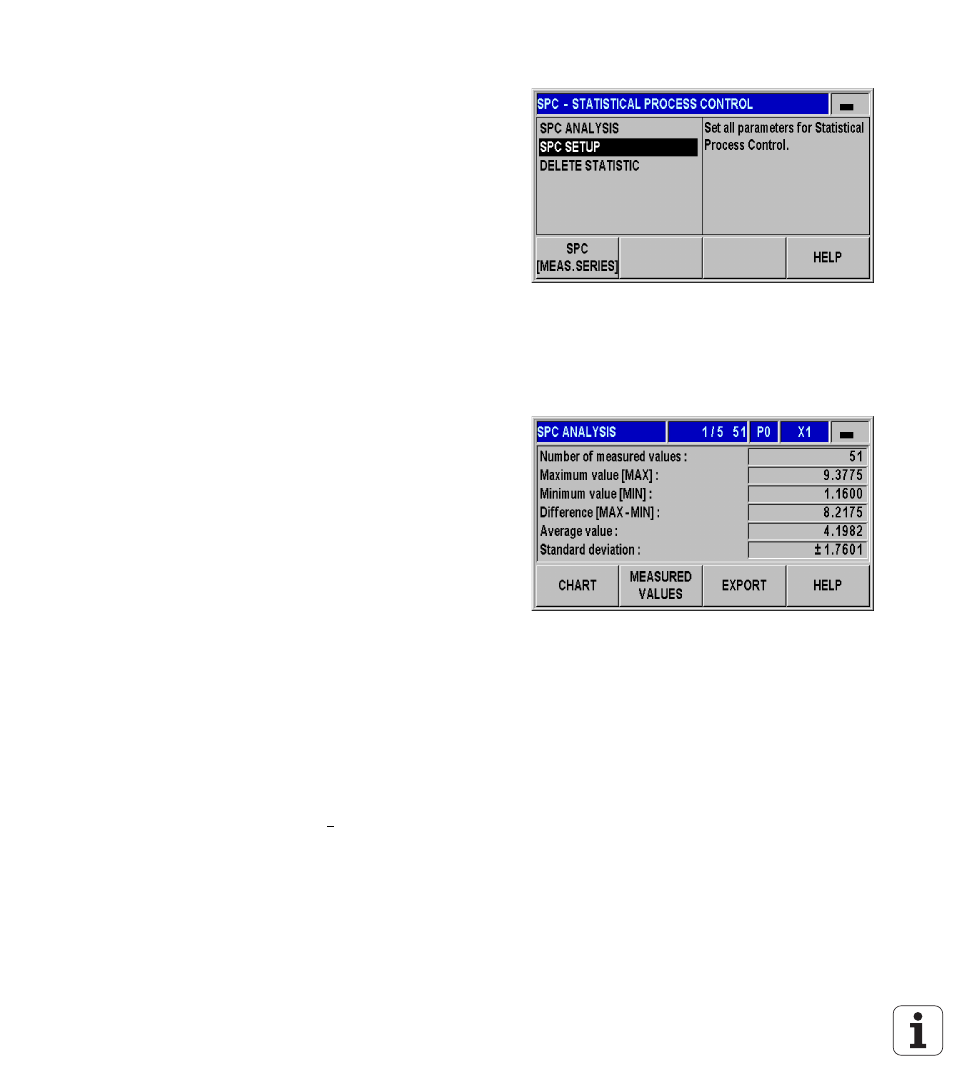
SPC analysis
The ND 287 provides the following possibilities for analyzing the
measured values recorded during statistical process control:
Call the SPC menu.
Select SPC ANALYSIS. This opens an overview of the SPC data:
Number of measured values, minimum and maximum measured
values, difference MAX-MIN, mean value and standard deviation.
This data is based on the measured values from the FIFO memory.
At the upper right of the screen the ND displays the sample
counter x/y z
, as well as the selected part and the selected axis or
coupled position, e.g. 1/5 51. x is the number of the measurement
that is currently being performed for the current sample (the total
number of measurements to be performed for each sample is
indicated in DATA PER SAMPLE), y is the number of measured
values per sample (indicated in DATA PER SAMPLE), and z is the
total number of measurements that have been recorded so far
(maximum of z = product of x multiplied by y). You can call the
analysis function immediately after switching the ND 287 on. The
number of recorded values depends on the sample settings you
have defined for SPC (see "Samples" on page 52).
Press the EXPORT soft key to transfer the recorded data to a PC.
Press the MEASURED VALUES soft key to open a table with all
recorded values. The measured values are listed in table format
(24 measured values per page).
Use the PAGE UP or PAGE DOWN key to scroll through the table
one page at a time.
Press the leftmost soft key to toggle through all evaluated diagram
types: Graph, histogram, control chart , control chart s and control
chart r. Press the C key to return to the SPC menu.
Fig. I.49 SPC menu
Fig. I.50 SPC data
x