HEIDENHAIN ND 287 User Manual User Manual
Page 50
50
I Working with the ND 287 position display unit
I – 5 Ser
ies of measur
ements and statistical
pr
ocess
c
ontr
ol
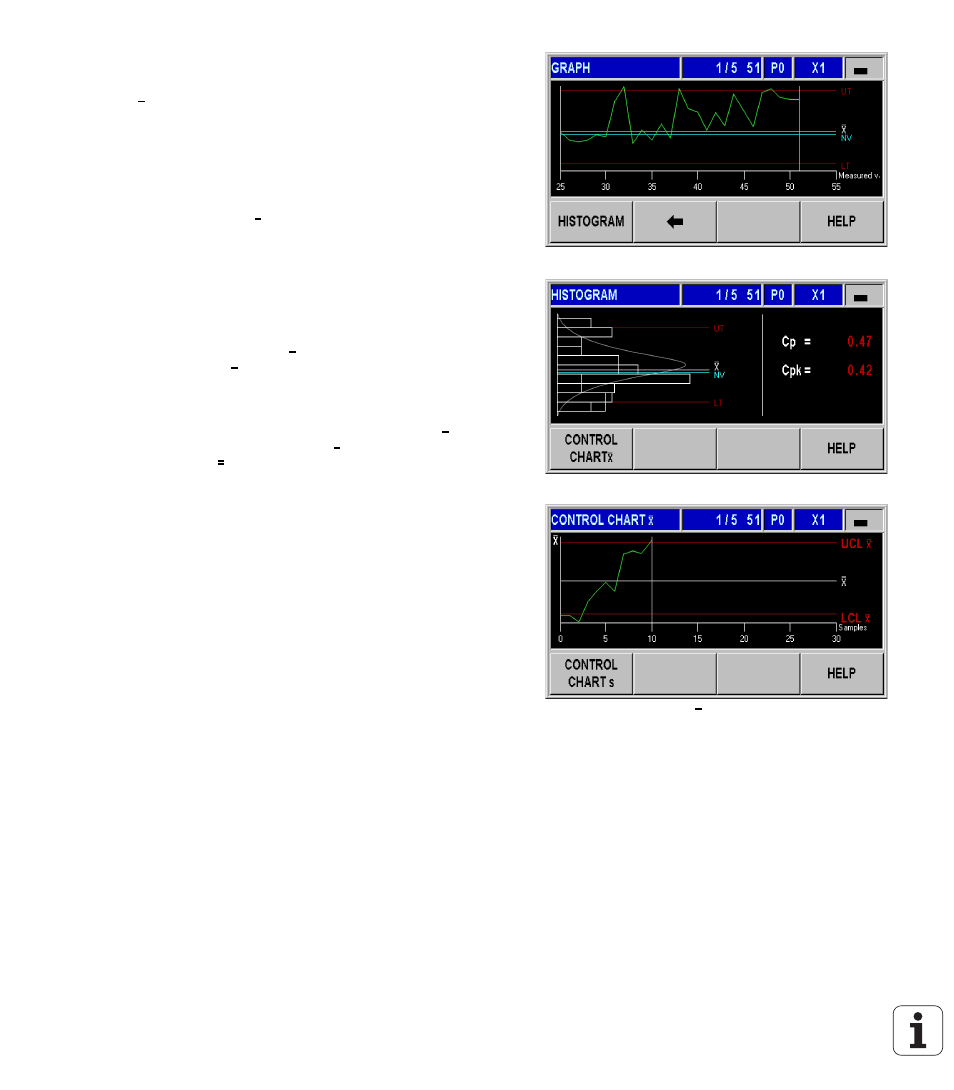
Press the GRAPH soft key to call a graphic display of all measured
values, including the lower tolerance limit LT, upper tolerance limit
UT
, nominal value (mean tolerance value) NV and the mean
value
. The graph shows the last 30 measured values. Use the
⇐
and soft keys to scroll the graph forward or backward by 25
measured values at a time.
Press the HISTOGRAM soft key to display a histogram of the
measured values. The histogram sorts all recorded values into 10
classes
. The histogram also shows the lower tolerance limit LT, the
upper tolerance limit UT, the nominal value (mean tolerance value)
NV
and the mean value . When a sufficient number of measured
values (at least half of the product of NUMBER OF SAMPLES
multiplied by DATA PER SAMPLE) is available after SPC has been
restarted, the ND 287 also draws the probability density curve in
the histogram. The ND 287 calculates the process capability
indices c
p
and c
pk
and displays them to the right of the histogram.
These values can be used to estimate the reliability of the process
within the defined specifications.
Press the CONTROL CHART soft key to display the control chart
for the mean value ( chart). The mean value of each sample is
entered in this control chart. The control chart shows up to 30 of the
last values. Use the
⇐
and soft keys to scroll the graph forward
or backward by 25 measured values at a time. The control chart also
shows the lower control limit for the mean value LCL , the upper
control limit for the mean value UCL and the mean value of all
measured values
. The violation of lower or upper control limit
and the position of the individual mean values are important for the
analysis of this control chart. For example, it is interesting to check
whether a trend or run is visible. For more information, please refer
to appropriate technical literature or ISO 21747.
Fig. I.51 Graph
Fig. I.52 Histogram
Fig. I.53 Control chart x
x
x
x
x
x
x
x