Calling the series of measurements menu, Analysis of series of measurements – HEIDENHAIN ND 287 User Manual User Manual
Page 43
ND 287
43
I – 5 Ser
ies of measur
ements and statistical
pr
ocess
c
ontr
ol
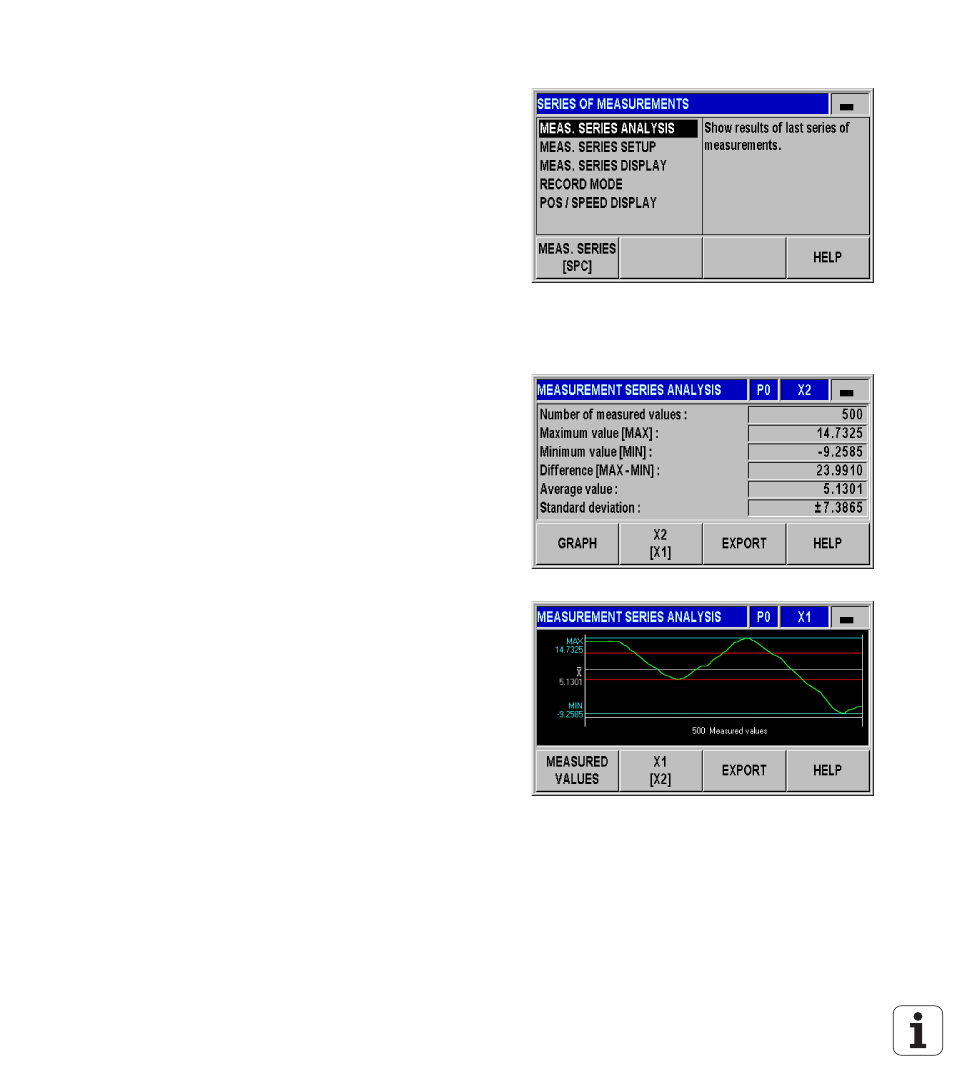
Calling the SERIES OF MEASUREMENTS menu
All parameters required for a series of measurements and the
possibility of analyzing a previously recorded series of measurements
are provided by the SERIES OF MEASUREMENTS menu.
To call the SERIES OF MEASUREMENTS menu, press the MEAS.
SERIES [SPC] soft key in the first soft-key row of the standard
screen.
Use the MEAS. SERIES ANALYSIS, MEAS. SERIES SETUP, MEAS.
SERIES DISPLAY , RECORD MODE and POS / SPEED DISPLAY
parameters to define further settings.
In the following sections you will find more detailed information on the
menu parameters.
Analysis of series of measurements
The ND 287 provides the following possibilities for analyzing the
recorded series of measurements:
Call the SERIES OF MEASUREMENTS menu.
Select MEAS. SERIES ANALYSIS. This opens an overview of the
statistical data
of the series of measurements: Number of
measured values, maximum and minimum measured value,
difference (MAX-MIN, also referred to as range), mean value and
standard deviation.
If you have recorded the measured values of both axes, you can
switch between the measured-value analyses of the two axes with
the X1 [X2] soft key.
Press the EXPORT soft key to transfer the recorded data to a PC.
Press the GRAPH soft key to call a graphic display of all measured
values, including the minimum, maximum and mean values of the
measurement series. If the sorting and tolerance checking mode is
active, the ND 287 also enters the sorting limits into the graph.
Press the MEASURED VALUES soft key to open a table with all
recorded values. The measured values are listed in table format
(24 measured values per page). If the sorting and tolerance checking
mode is active, all measured values that are outside the sorting
limits are displayed in red in the table.
Use the PAGE UP or PAGE DOWN key to scroll through the table
one page at a time.
Press the STATISTICAL DATA soft key to return to the overview of
statistical data.
Fig. I.36 SERIES OF MEASUREMENTS menu
Fig. I.37 Statistical data of series of measurements
Fig. I.38 Diagram