Pseudo-contour plots, Pseudo-contour plots -30 – HP 48g Graphing Calculator User Manual
Page 330
Attention! The text in this document has been recognized automatically. To view the original document, you can use the "Original mode".
i tii
Example:
Enter the «/-coordinate of the eyepoint. It must be
at least one unit smaller than the value for Y--NEflR»
above. The greater the difference between YE 5 and
Y-NEFlR s, the “farther away” the plot will appear.
Enter the
2
-coordinate of the eyepoint. Use the
midpoint of the
2
-axis range for the View Volume if you
want the plot “centered” vertically in the display.
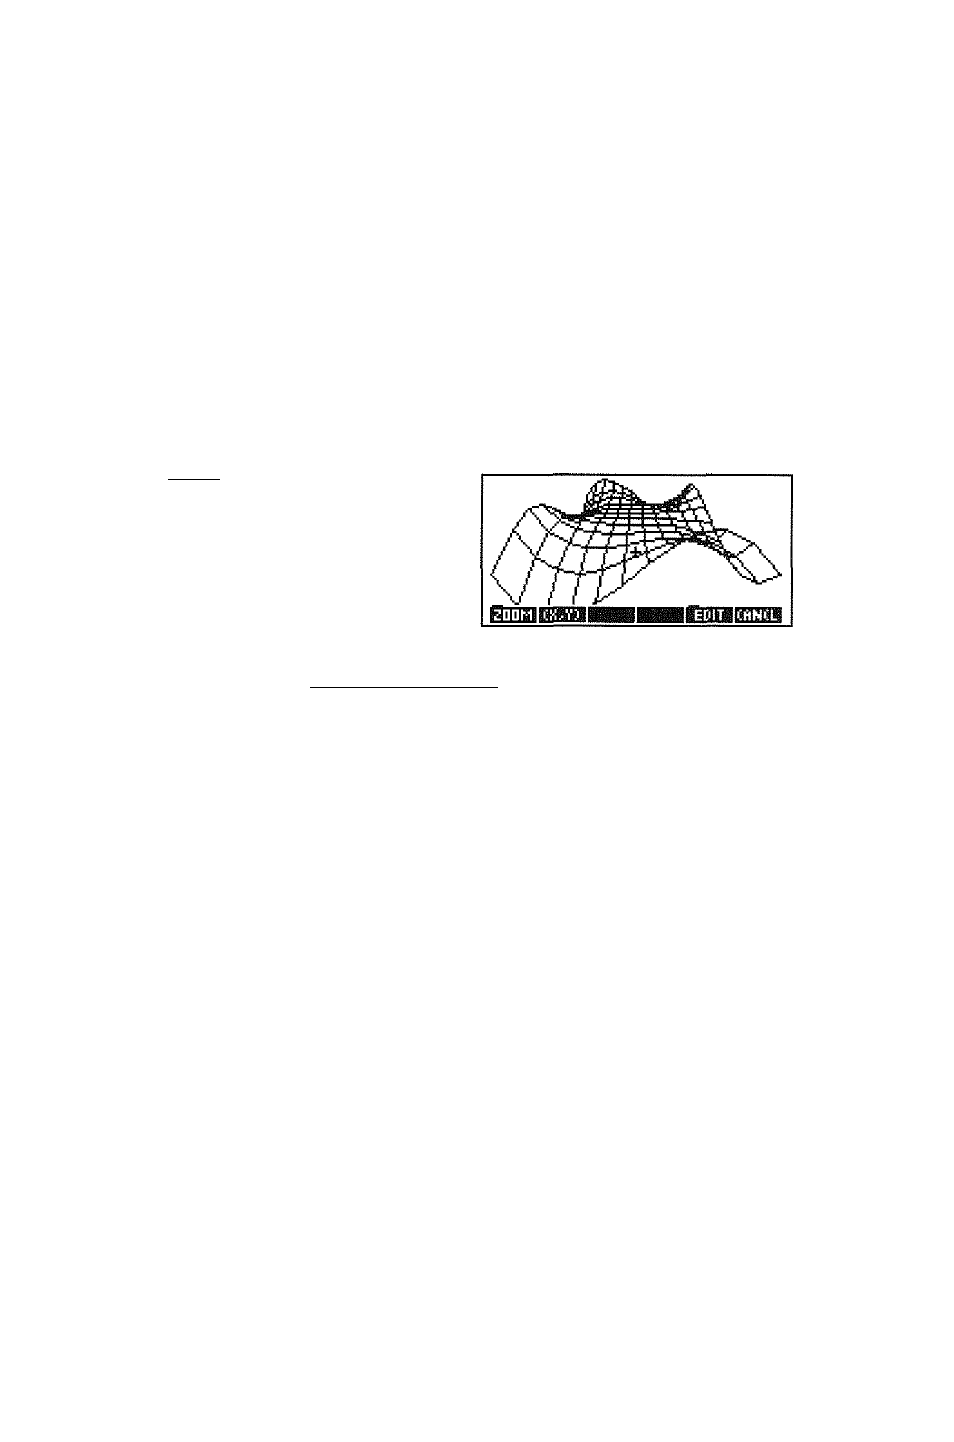
Display the Wireframe example plot, WIRE :
2
= x^y — xy^. If necessary, type in TEACH to install the
EXAMPLES directory and then:
Press
fVAR)
fNXT)
23
After plotting, press
(CANCEL) frRfPLOT
) to review the PLOT forms
that generated the plot. Experiment by changing values or settings
and redrawing the plot.
Pseudo-Contour Plots
The Ps-Contour plot type plots a lattice of line segments, each tangent
to a contour of the function (a curve satisfying f’("a;,?/j=constant).
It computes a tangent for each point in the sampling grid. The
Ps-Contour produces a “fast” contour plot, allowing your eye to pick
out the integral curves (contours) without actually plotting them.
23-30 Plot Types