Operation – Outback Power Systems MATE3 Owners Manual User Manual
Page 47
Operation
900-0117-01-00 Rev C
45
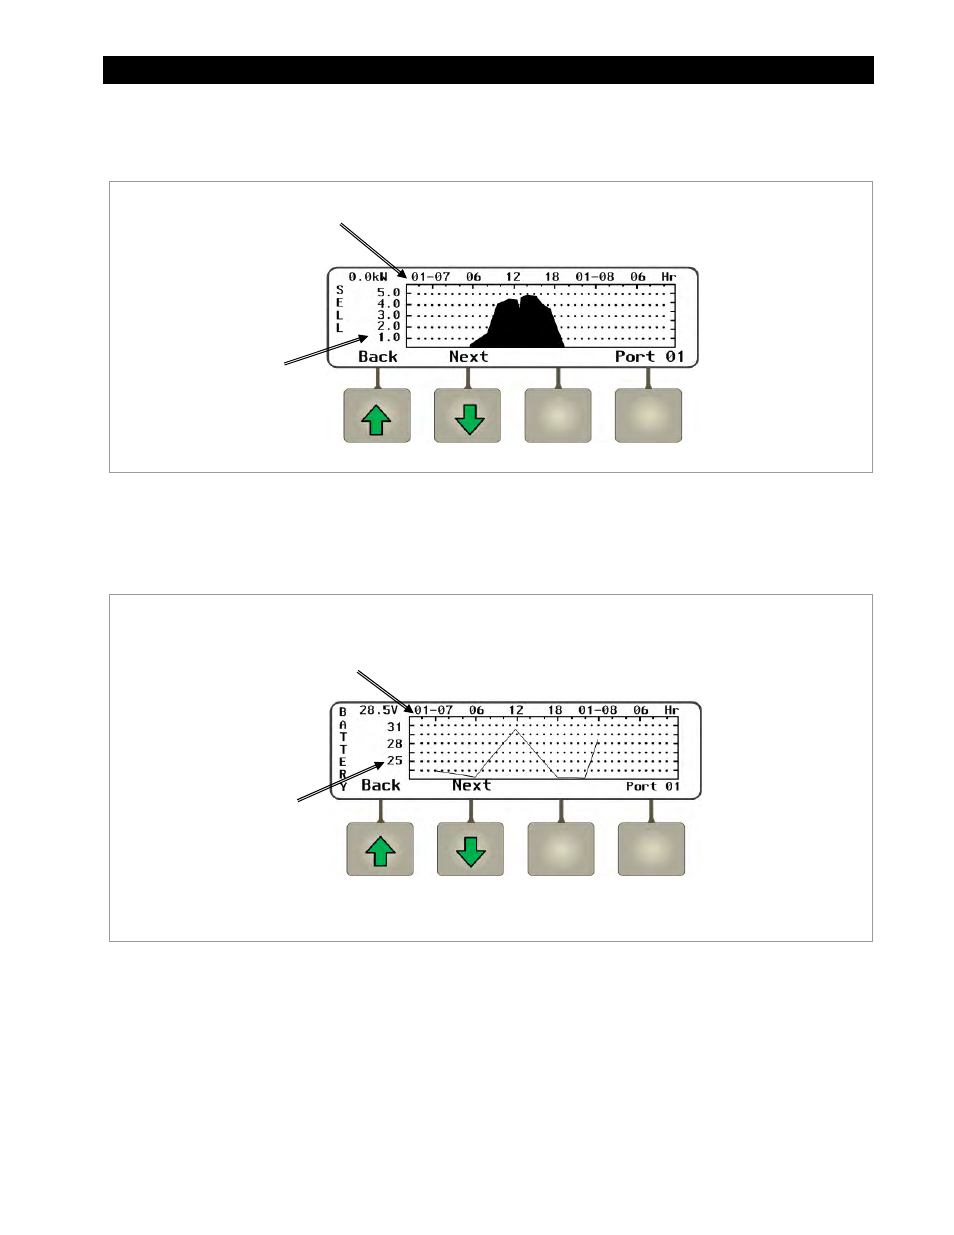
The
grid-interactive system over time.
Figure 35
Sell Graph
The
used by other soft keys.
Figure 36
Battery Graph
Continuing to press the
This axis shows
sold wattage.
This axis shows date and time
in 6-hour increments.
This axis shows
battery voltage.
This axis shows date and time
in 6-hour increments.
See also other documents in the category Outback Power Systems Power suppliers:
- GS8048 (44 pages)
- GTFX2524 (2 pages)
- VFX 3524M (65 pages)
- FX2012MT (2 pages)
- Systems (24 pages)
- Sealed FX (2 pages)
- VFX Series (2 pages)
- Hitch DOM-OBK03 (32 pages)
- GFX Series Inverter/Charger Installation Manual (40 pages)
- GFX Series Inverter/Charger Operators Manual (64 pages)
- GFX International Series Installation Manual (40 pages)
- GFX International Series Operators Manual (64 pages)
- GS8048 Installation Manual (44 pages)
- GS8048 Operator Manual (60 pages)
- GS Load Center Installation Manual (48 pages)
- GS Load Center Installation Manual (60 pages)
- Radian Series Inverter/Charger Service Instructions (8 pages)
- GS8048 Quick Start Guide (4 pages)
- GS7048E Installation Manual (48 pages)
- GS7048E Operators Manual (76 pages)
- GS7048E Quick Start Guide (4 pages)
- GS8048A Quick Start Guide with GSLC (4 pages)
- GS8048A Installation Manual (48 pages)
- GS8048A Operators Manual (76 pages)
- FX Series Installation Manual (60 pages)
- FX Series Programming Manual (59 pages)
- FX Series Circuit Board Replacement Instruction (9 pages)
- FX Series International Installation Manual (47 pages)
- FX Series Export Inverter/Charger Programing Manual (56 pages)
- GTFX Series Inverter/Charger Programing Manual (32 pages)
- GTFX Series Inverter/Charger Programing Manual (64 pages)
- GTFX Series Inverter/Charger Installation Manual (88 pages)
- PV 8 Combiner (28 pages)
- FW-X240 Installation Manual (16 pages)
- PSX-240-Relay Installation Manual (8 pages)
- FLEXware 250 - Users Guide (16 pages)
- FW-IOB-S-120VAC Input/Output/Bypass Assembly - Installation Instructions (8 pages)
- FW-IOB-S-230VAC Input/Output/Bypass Assembly - Installation Instructions (8 pages)
- FLEXware ACA AC Conduit Adapter Users Guide (8 pages)
- FLEXware Mounting Plate Users Guide (12 pages)
- FLEXware 500 Users Guide (12 pages)
- FW-IOB-D-120VAC Input/Output/Bypass Assembly - Installation Instructions (8 pages)
- FW-IOB-D-120/240VAC Input/Output/Bypass Assembly - Installation Instructions (8 pages)
- FW-IOB-D-230VAC Input/Output/Bypass Assembly - Installation Instructions (8 pages)
- FLEXware MATE3 Mounting Bracket - Installation Instructions (2 pages)