HP OneView User Manual
Page 212
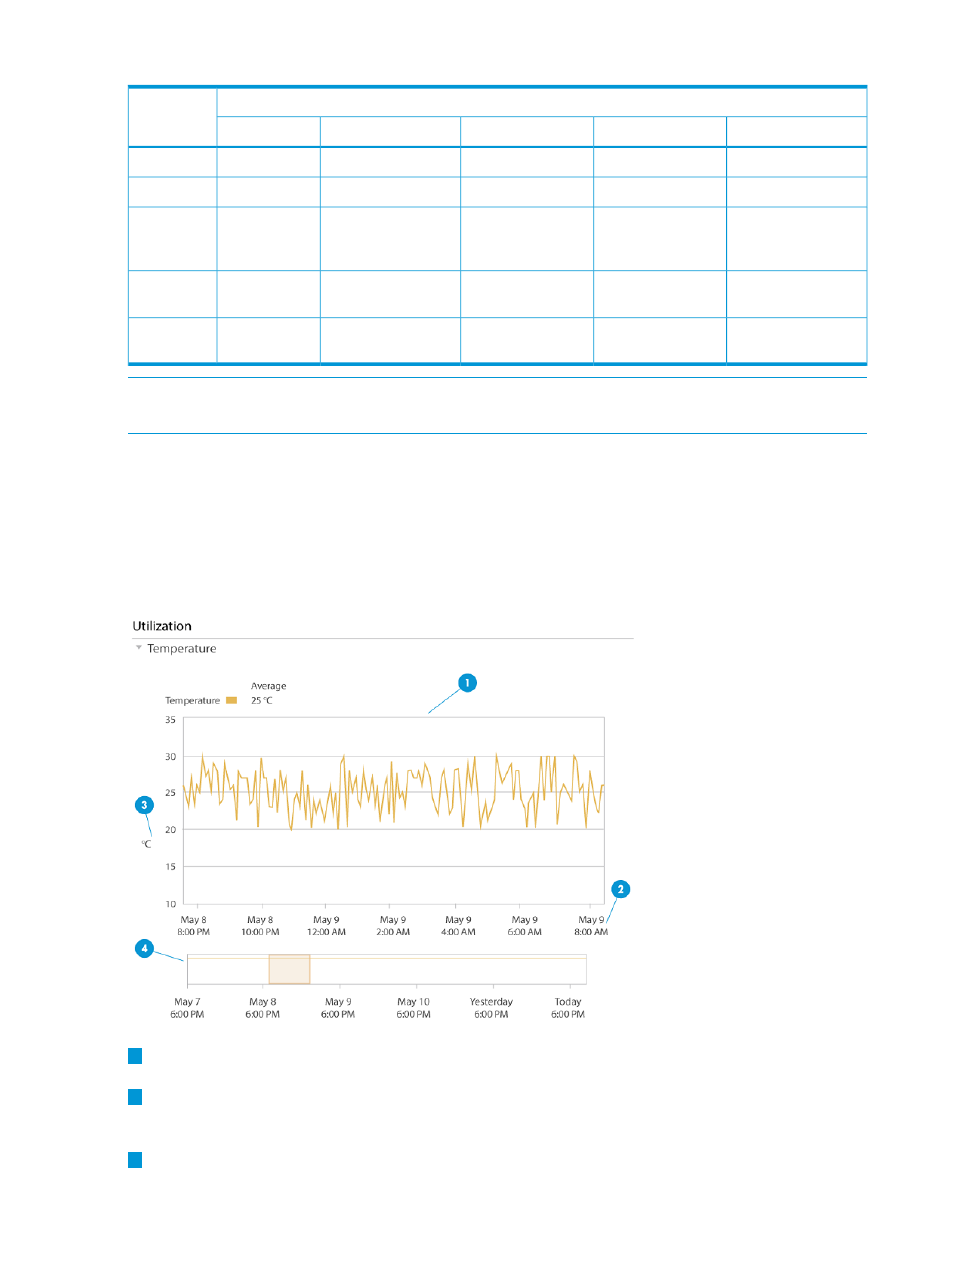
Table 15 Utilization statistics gathered by resource
Utilization metric
Capacity
Custom
Temperature
Power
CPU
Resource
✓
✓
✓
Enclosures
✓
✓
Racks
✓
Power
Delivery
Devices
✓
✓
✓
✓
Server
Hardware
✓
Storage
Systems
NOTE:
You can use the Interconnects screen to view utilization graphs that display data transfer
statistics for interconnect ports. See the online help for the Interconnects screen.
Utilization statistics and licensing
Utilization statistics and graphs are disabled for server hardware that does not have an iLO license
assigned. See
to learn more.
If utilization is disabled, the Utilization panel displays a message stating the reason it is disabled
in the details pane for the unlicensed resource.
Utilization graphs
1
Primary graph: The large primary utilization graph displays metric data (vertical axis) for your
devices over an interval of time (horizontal axis) using a line to graph data points.
2
Horizontal axis: The horizontal axis on the primary utilization graph depicts the time interval
for the data being displayed, with the most recent interval data on the right. The minimum
time interval is two minutes and the maximum is five days.
3
Vertical axis: The vertical axis on the primary utilization graph depicts the interval for the
metric displayed in the corresponding unit of measurement down the left side of the graph.
212
Monitoring power and temperature