Bar graph – Yokogawa Value Series FX1000 User Manual
Page 19

1-10
IM 04L21B01-01EN
Status Display Section
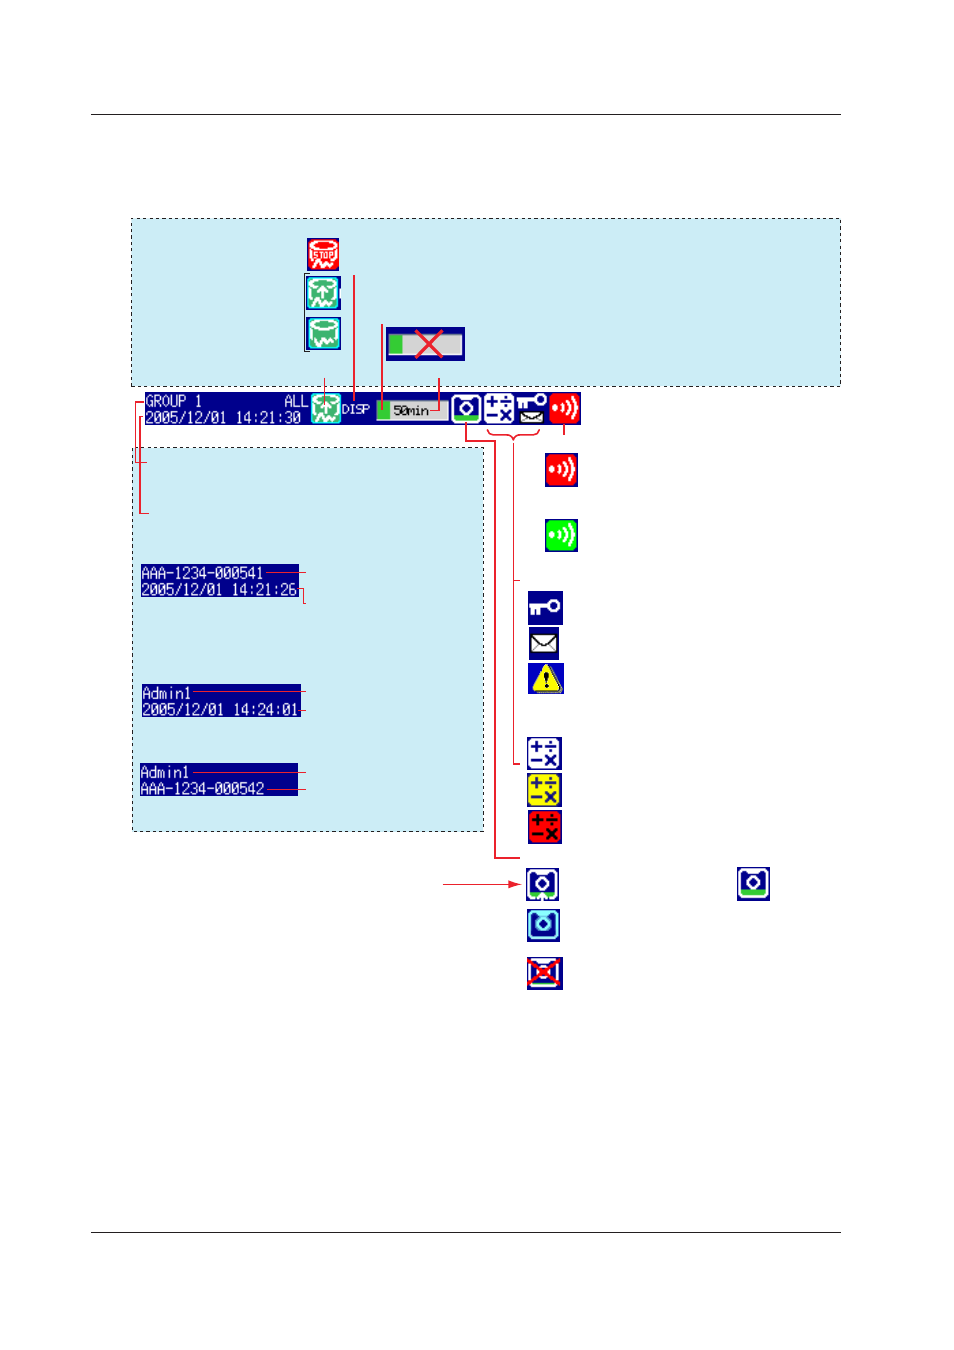
The following information is displayed in the status display section during operation mode
or setting mode.
Memory sampling status
CF card icon (on FXs that have a CF card slot)
Waiting.
Light blue icon: CF card in the slot is not
recognized. Remove and reset it.
CF card error.
Carry out the procedure below to reset the CF
card icon to normal.
• Remove the CF card, and then reinsert it.
• Replace the CF card with a normal one.
• Use the FX to format the CF card (the CF
card data will be deleted).
The green level display indicates the amount of
CF card used. If Media FIFO* is not enabled and
the free space on the CF card falls below 10%,
the level indicator changes to red.
* See section 1.4 in the FX1000 User’s Manual.
Memory sampling icon
Memory sampling
stopped
Memory sampling
in progress
Computation icon (/M1, /PM1, and /PWR1 options)
(Red)
(Green)
CF card is being accessed.
The status assigned to the status output
(/F1 option) is occurring.
Keys are locked.
E-mail transmission (/C7 option) is enabled.
Status icon
Data type
DISP: Display data
EVENT: Event data
Memory sampling progress
Displays the progress using a green bar graph. The frame indicates the file
save interval (display data) or the data length (event data).
Error in internal memory.
Contact your nearest YOKOGAWA dealer.
Displays the remaining memory sampling time for the left bar graph.
Date and time
Displayed in yellow while the time is being corrected.
Display name or group name
For all channel display on the trend display, “All” is
displayed.
When using the batch function
If the “batch number-lot number” exceeds 20 characters,
the “date and time” position is used to display the “batch
number-lot number.”
Batch name and the display
name are shown alternately.
Date and time
Name of the user logged in
Batch name, the display
name, and date and time are
shown alternately.
When using the login function
Name of the user logged in
When using the login and batch functions
Date and time and the
display name are shown
alternately.
Displayed when any alarm is activated.
Blinks when there are alarms that are
occurring but have not been acknowledged.
All alarms have been released after they
have occurred, but there are alarms that
have not been acknowledged.
Alarm icon
White icon: Computation started
Yellow icon: Computation data dropout occurred
Red icon: Error in the power measurement
section
Bar Graph
When event data recording is set to pretrigger, the FX will start recording pretrigger
data after you press the START key. “Waiting” appears in the bar graph. At this time,
the progress bar will turn orange. After the pretrigger time elapses, the length of the bar
fixed at that point. However, the relevant data is updated until the trigger condition is met.
When the trigger condition is met, the bar turns green, and data is recorded after the data
in the pretrigger section.
1.3 Display
