Cascade – Watlow EZ-ZONE PM Integrated Controller User Manual
Page 154
Watlow EZ-ZONE
®
PM Integrated Controller
•
151
•
Chapter 10 Applications
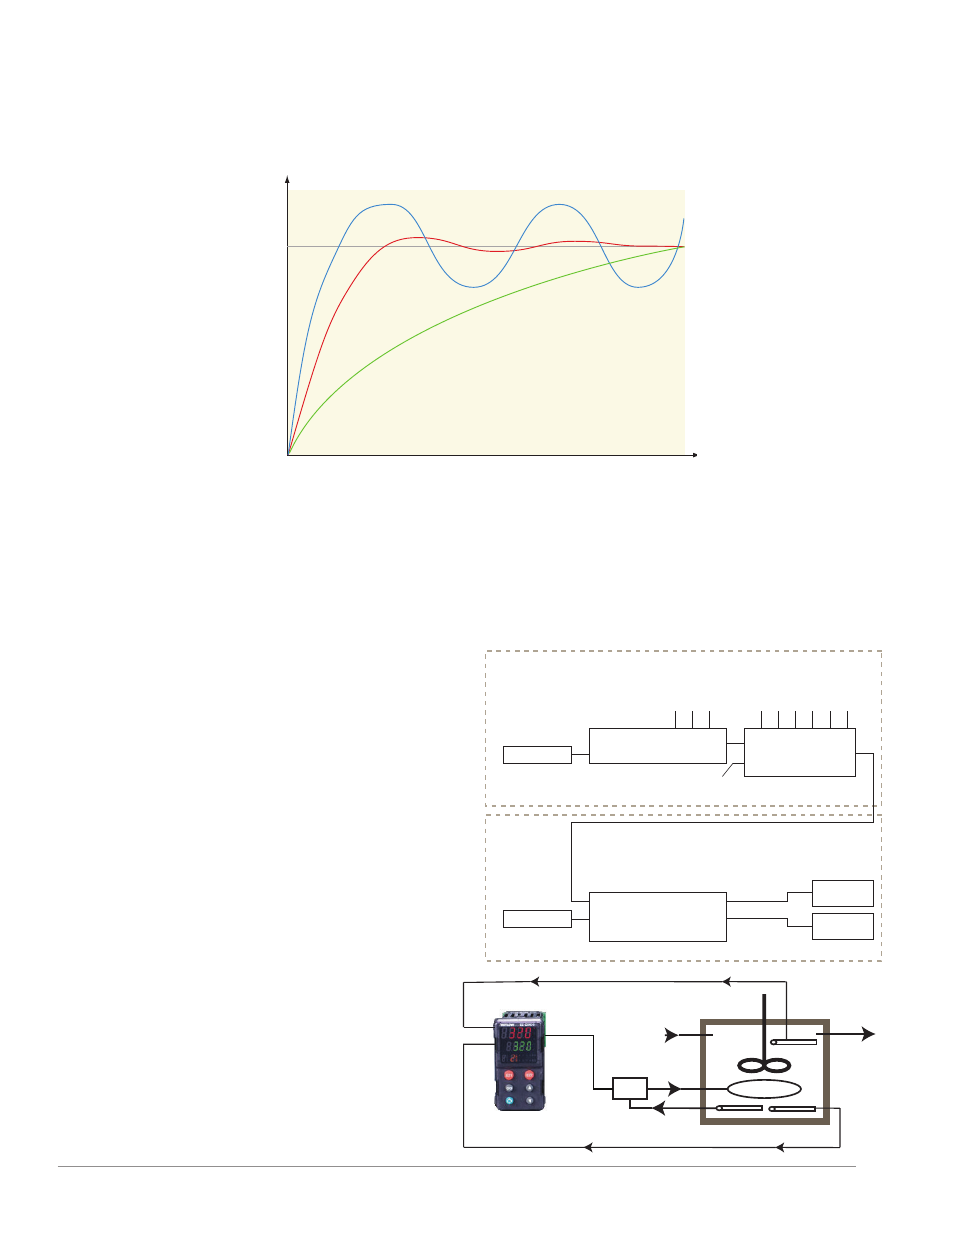
The graph below illustrates a system with a long lag time and the advantages in using cascade control. Curve
A represents a single-control system with PID parameters that allow a maximum heat-up rate. Too much energy
is introduced and the set point is overshot. In most long-lag-time systems the process value may never settle out to
an acceptable error. Curve C represents a single-control system tuned to minimize overshoot. This results in unac-
ceptable heat-up rates, with the final value taking hours to reach. Curve B shows a cascade system that limits the
energy introduced into the system allowing an optimal heat-up rate with minimal overshoot.
When the Math function is set for Process or Deviation Scale and Source E is not connected or false, cascade
control is enabled.
Note:
When the Math function is set for Process or Deviation Scale the PM automatically makes the connections for
each Control Loop as shown in the graphic below. Each loop, 1 (process) and 2 (energy) outer and inner respective-
ly, cannot be changed. If it is desired to display the inner loop process variable and set point, the home page must
be changed via the Factory Page, Custom Menu.
Cascade control uses two control loops (outer - loop 1
and inner - loop 2) to control the process. The outer loop
(Analog Input 1) monitors the process or part tempera-
ture, which is then compared to the Closed Loop Set
Point. The result of the comparison, the error signal,
is
acted on by the PID settings and the Range and Scale
high/low settings. Ultimately, the outer loop produces a
remote set point for the inner loop. The inner loop input
(Analog input 2) monitors the energy source (heating and
cooling), which is compared to the remote set point gener-
ated by the outer loop. The result of the comparison, the
error signal, is acted on by the PID settings in the cas-
cade inner loop (2), which generates an output power lev-
el
between -100% to +100%. If the power level is positive the
heat will be on; if the power level is negative the cool will
come on. Power from the energy sources are supplied by
the outputs of choice always referenced to Control loop 2.
When cascade control is disabled (Source E is true), the
Math function output will equal Control Loop 1, Closed
Loop Set Point.
Note:
If an input sensor on the outer loop fails when using
deviation cascade the inner loop will continue to drive
the output.
-100% = Range Low
+100% = Range High
Outer Loop 1
Process
Control Loop 1
Control Loop 2
Inner Loop 2
Energy
Cascade
Filter
Scale Low
Scale High
Range High
Range Low
Function
Remote Set
Point
Source E
Output
Heat Power
Cool Power
Closed Loop SP
Math Function
DIO
or
Function Key
0 to 100%
0 to 100%
Analog Input 1
Analog Input 2
Process Sensor
Energy Source
Closed Loop
Set P
oint
1
Heat
Algorithm
Cool
Algorithm
Heat
Cool
Output n
Output n
Time
Temperatur
e
Cascade
Curve A (PID)
Set
Point
Curve B (Cascade)
Curve C (Single-control)
Heater
Oil In
Limit
Limit Thermocouple
Lube Oil Tank
Oil Out
Output 1
Input 2
Input 1
Inner Loop
Thermocouple
Outer Loop
Thermocouple
Note:
When using cascade
control, two loops of
control are required.
Changing the control
mode in either loop
will affect both loops
of control. In other
words, if loop one is
changed to manual
mode, loop two will
also be changed to
manual mode auto-
matically.