Percent display, Range display, Bar graph display – Toshiba LF600F User Manual
Page 41: Toshiba
Attention! The text in this document has been recognized automatically. To view the original document, you can use the "Original mode".
TOSHIBA
,6,F,8,A0,8,6,9,
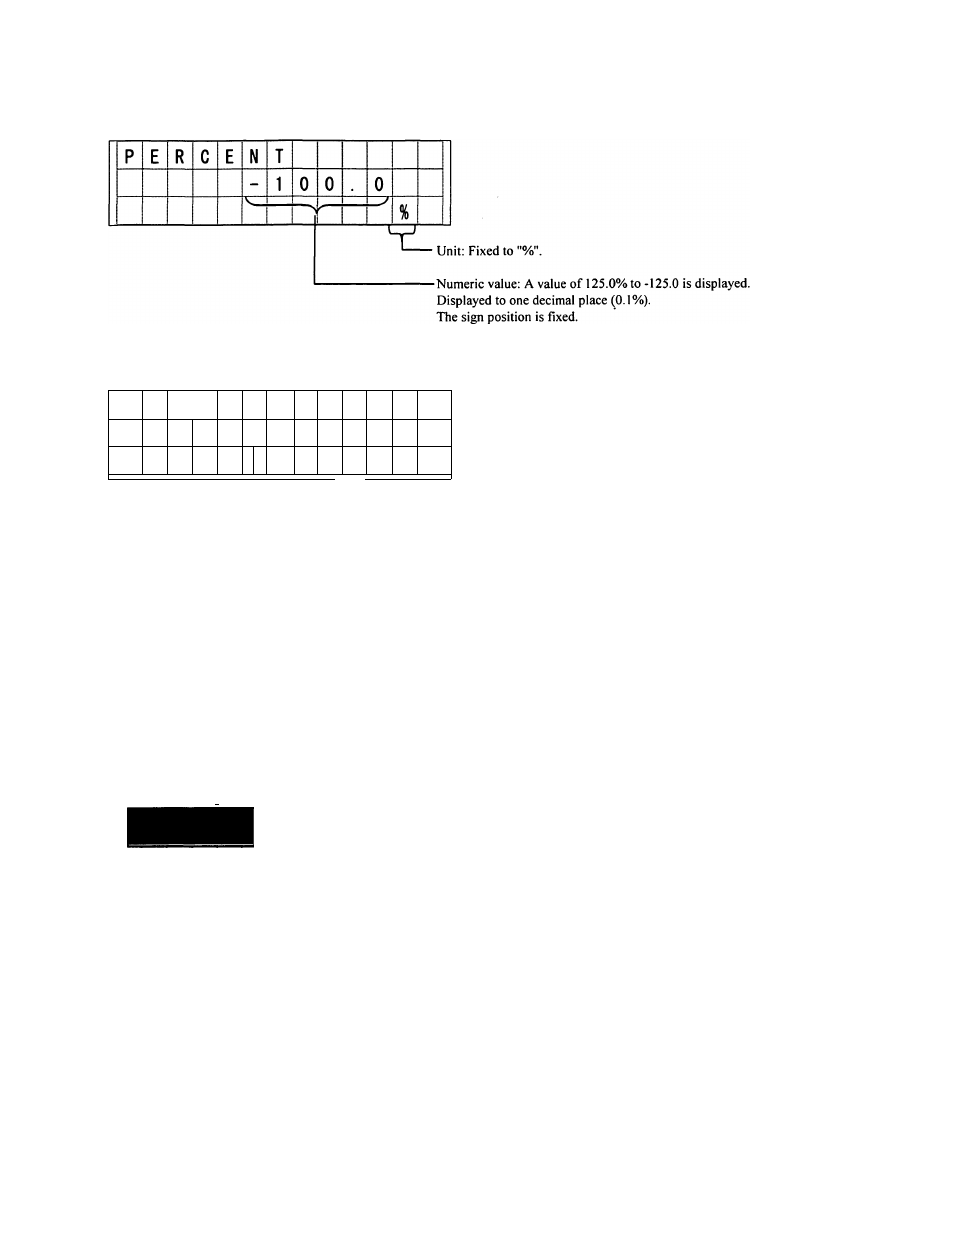
Percent display
Range display
R
A
N |
g
E
1
1
2
0
0
0
J
m /
s
T
Unit: Displayed right aligned (up to 7 digits).
Numeric value: Span value of the range used
Range used
In the range display, the range currently being used is displayed (any one of ranges 1 to 4). The screen
example above shows that range 1 is currently being used.
If multiple ranges have been set, the displayed range is switched automatically as the range used is
changed.
Bar graph display
0 I W
!
R lA IN
2 1
.
0 | 0 i
! I
y \
EMI
__
m i /
j
—
The measured value is displayed as a bar graph (12 digits, 100 dots).
The left of the graph is RL and the left of the graph is RH.
a scale is displayed in increments of 25% inside the graph.
— Range unit.
— Range H: Span value of the range currently being used.
— Display of the range used
-
40
-