Figure 5-9 view results screen -6, Figure 5-10 rate vs. time process log graph -6 – INFICON MDC-360 Thin Film Deposition Controller User Manual
Page 80
MDC-360 DEPOSITION CONTROLLER
5-6
Process Name Run# Time Date
0002 12:05 12/28/
<
Aborted
us
94 Normal
Stat
>Sample
Sample 0001 09:54 01/23/95
Figure 5-9 View Results Screen
This screen displays the process name, run number, starting time and date and the
status. The status can be either running, normal,
aborted or overrun. Overrun
means that this process overran itself within the data store.
s
ange to the rate vs. time graph
shown in Figure 5-10. The logged data will be plotted for the first layer of the
ds for short layer to up to 15
data
tween the four
graphs. You can also enter a different layer number to view another layer.
To select a process log for viewing, just move the cursors onto the desired proces
and press the Enter or the Right-arrow key. Please note that you cannot view a
process log while in-process.
Once a process has been selected, the screen will ch
process. Plotting the data may take from 5 secon
seconds or more for long layers with a lot of data. Please note that while the
is being plotted the controller will not read any key presses. When the data has
been plotted the layer number will be displayed in the upper right hand corner of
the screen. At this point you can press the Status key to switch be
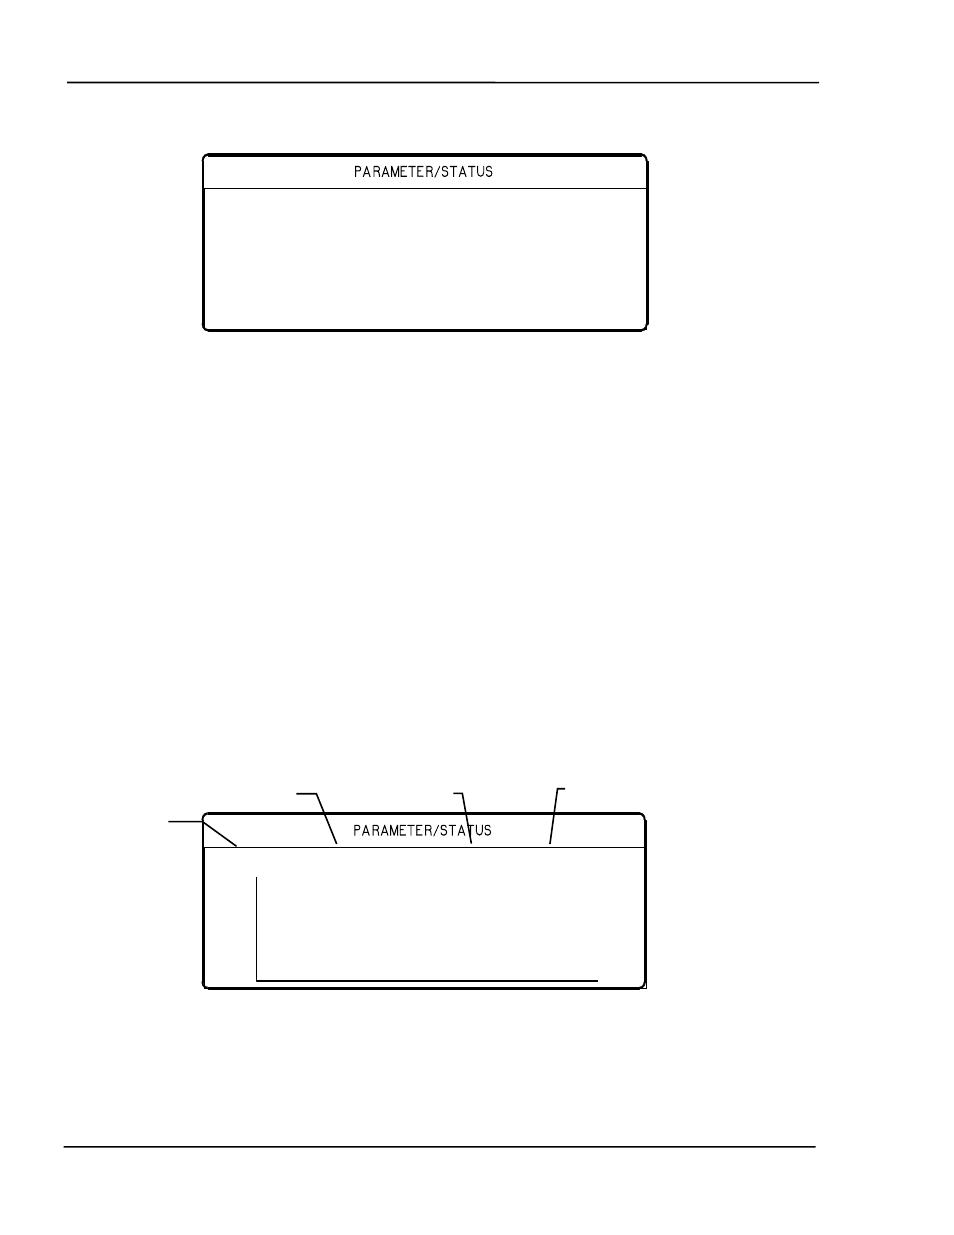
Sample Cr Lyr>001< (001-999)
10
R
a
t
Displays the current
process name.
Displays the current
layer material name.
Displays the current
layer number.
Displays the process
layer range.
OPERATING THE MDC-360
Figure 5-10 Rate vs. Time Process Log Graph
press the Left-arrow key.
To return to the process log,
e
0 1