2 display of the titration curve – Metrohm 799 GPT Titrino User Manual
Page 87
2.10 Data output
799 GPT Titrino
83
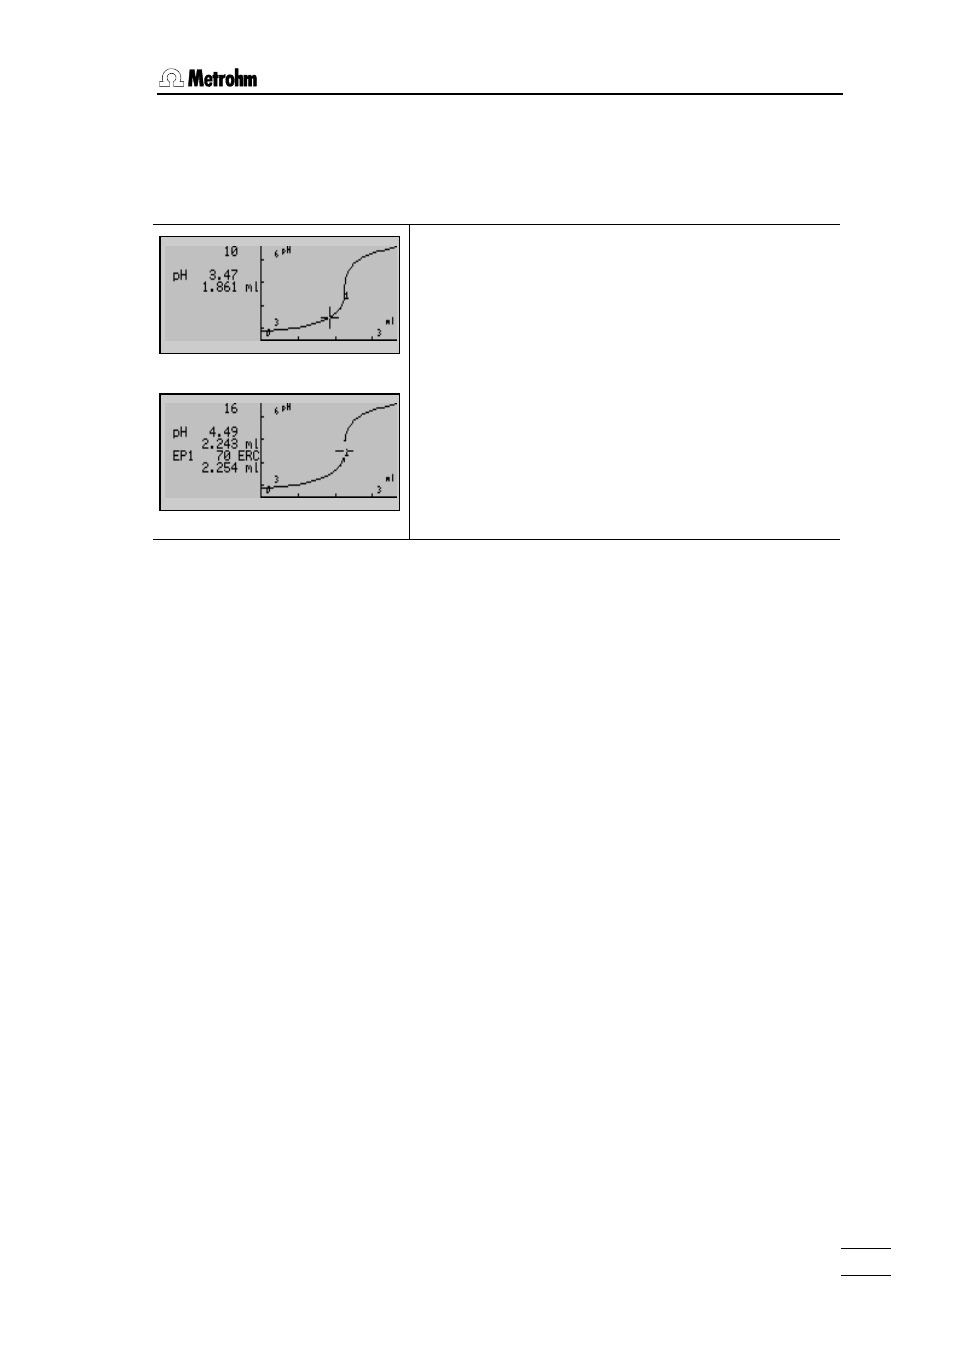
2.10.2 Display of the titration curve
After the titration, the curve can be viewed.
Switch between "curve" and "result display" with key
You can trace the curve with keys <↑> and <↓>. In
the text field to the left of the curve the index of the cur-
rent measured value is displayed in the first line. In the
subsequent lines, the corresponding measured values
are shown.
If you place the cursor in DET and MET curves onto the
EP, the data of this EP are also shown.
• The EP number and its ERC (Endpoint Recognition
Criterion).
• The EP volume.
See also other documents in the category Metrohm Equipment:
- 915 KF Ti-Touch (382 pages)
- 800 Dosino (53 pages)
- 767 Calibrated Reference (23 pages)
- 940 Professional IC Vario ONE/SeS/Prep 2 (54 pages)
- 754 Dialysis Unit (49 pages)
- 815 Robotic Soliprep for LC (76 pages)
- Vision Manual (207 pages)
- tiamo 2.1 Manual (1532 pages)
- 825 Lab Link (37 pages)
- 808 Titrando (70 pages)
- 902 Titrando (52 pages)
- 756 KF Coulometer (163 pages)
- 756 KF Coulometer (162 pages)
- 940 Professional IC Vario ONE/LPG (98 pages)
- 850 Professional IC Anion MCS Prep 3 (154 pages)
- 850 Professional IC Anion MCS Prep 3 (152 pages)
- 904 Titrando (58 pages)
- 850 Professional IC Anion MSM-HC MCS Prep 2 (150 pages)
- 930 Compact IC Flex Oven/ChS/Deg (47 pages)
- 872 Extension Module Liquid handling (64 pages)
- 814 USB Sample Processor (90 pages)
- 814 USB Sample Processor (91 pages)
- 940 Professional IC Vario (43 pages)
- Vision – Tutorial (40 pages)
- 889 IC Sample Center (68 pages)
- 761 Compact IC (228 pages)
- 851 Titrando (100 pages)
- 748 DH Sample Changer (32 pages)
- 940 Professional IC Vario ONE/SeS/HPG (51 pages)
- 896 Professional Detector – Amperometry (62 pages)
- 877 Titrino plus (139 pages)
- 881 Compact IC pro – Anion (129 pages)
- 940 Professional IC Vario ONE/ChS/HPG (112 pages)
- 930 Compact IC Flex Deg (41 pages)
- 840 PC Control 5.0 / Touch Control (351 pages)
- 940 Professional IC Vario ONE/Prep 1 (45 pages)
- 776 Dosimat (42 pages)
- 717 Sample Changer (36 pages)
- 815 Robotic USB Sample Processor XL (113 pages)
- 815 Robotic USB Sample Processor XL (114 pages)
- 940 Professional IC Vario ONE/SeS/PP (126 pages)
- 838 Advanced Sample Processor Installation Instructions (109 pages)
- 700 Dosino (55 pages)
- 719 S Titrino (152 pages)