Formatting the elements in a data series – Apple Keynote '08 User Manual
Page 155
Chapter 8
Using Charts
155
4
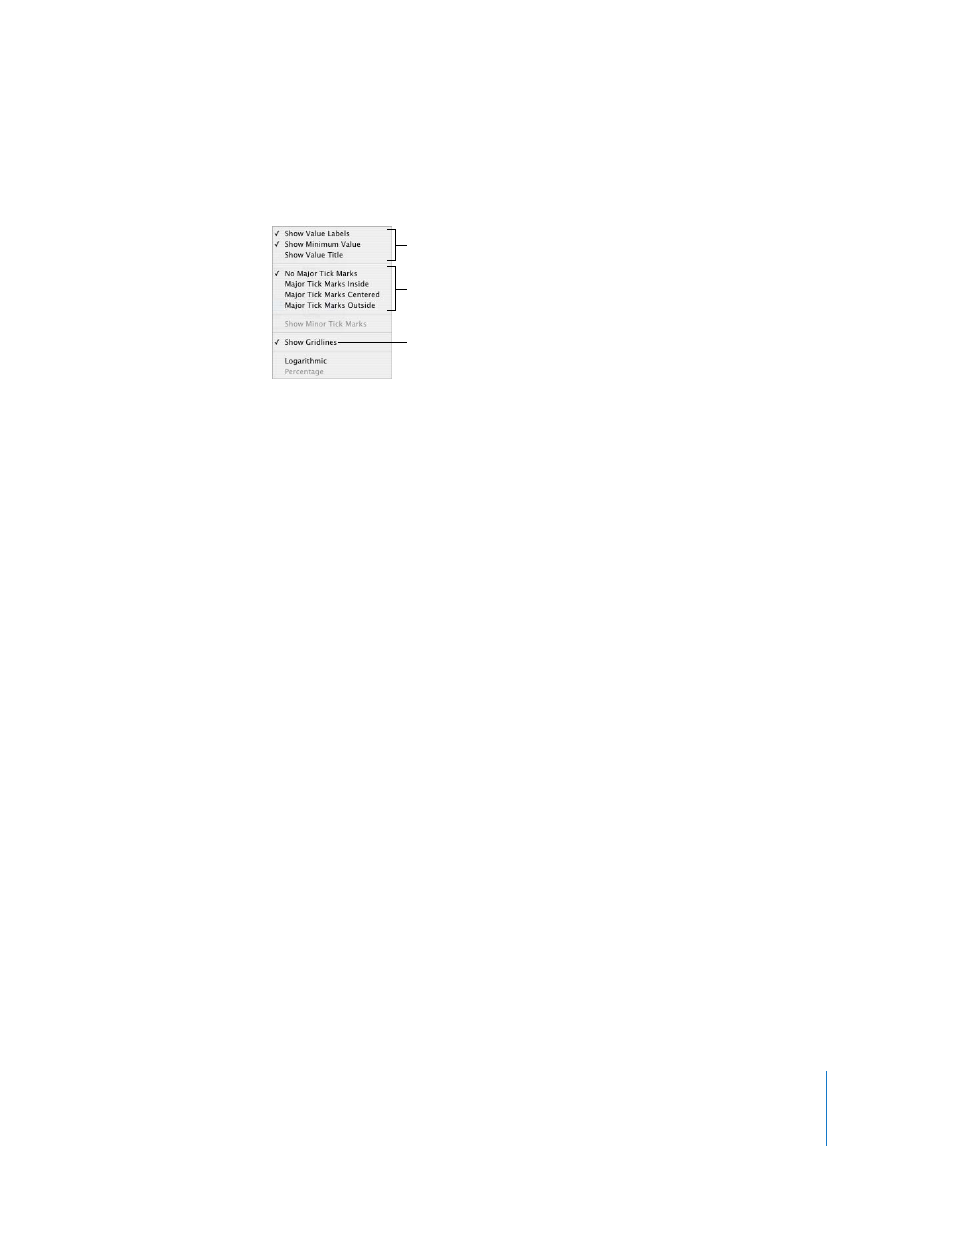
To format the Y-axis, choose an option from the Y-Axis pop-up menu. Here’s what the
menu looks like for a column chart:
Formatting the Elements in a Data Series
You can use a variety of visual effects to enhance the appearance of data series
elements, such as bars, wedges, and area shapes.
To format data series elements:
1
To format all data series, select the chart.
To format elements in a single data series, select the chart and then click one of the
elements in the series.
For all chart types except pie charts, selecting one element (such as a bar) of a series
automatically selects the full series. For pie charts, you select individual wedges.
2
To fill series elements with specially designed colors or textures, click Inspector in the
toolbar, click the Chart Inspector button, and then click Chart Colors.
Choose a fill type (for example, 3D Texture Fills) from the first pop-up menu, and
choose a fill collection (for example, Marble or Wood) from the second pop-up menu.
To fill all the elements in all the data series, click Apply All. The first fill is applied to
elements in the first series, the second fill to elements in the second series, and so on.
To fill elements in a single data series, drag the fill to an element (bar, column, and so
on) in the series.
3
To adjust the opacity, stroke, shadow, and other graphical attributes of series elements,
click the Graphic Inspector button.
4
To adjust series element colors, see “Filling an Object with Color” on page 79.
5
To use one of your own images to fill series elements, see “Filling an Object with an
Image” on page 81.
6
To format data point labels, see “Showing Data Point Labels” on page 153.
“Formatting Specific Types of Charts” on page 156 provides instructions for formatting
charts of particular types.
Place tick marks along
the Y-axis.
Show or hide the
Y-axis gridlines.
Show or hide value
axis labels.