Using charts, About charts, Chapter 8 – Apple Keynote '08 User Manual
Page 144
8
144
8
Using Charts
You can convert data from tables into attractive charts. This
chapter outlines the basics of creating and formatting charts.
Keynote provides tools for creating your own visually appealing charts to present
numerical data. You can copy and paste your data from a spreadsheet, or type it
directly into the Chart Data Editor to create and edit your charts right on the slide
canvas. By default, the appearance of charts is coordinated with the theme you’re
using.
About Charts
You can display data in a chart to visually reveal trends or relationships that aren’t as
apparent when you view the data in rows in columns. You can choose from a variety of
chart types to present your data, including pie charts, line charts, bar charts, column
charts, area charts, and scatter charts. Most charts have both two-dimensional and
three-dimensional versions.
To enter the data to show in a chart, you use the Chart Data Editor, as “Editing Chart
Data” on page 149 describes. If you change data in the Chart Data Editor, the chart
updates automatically.
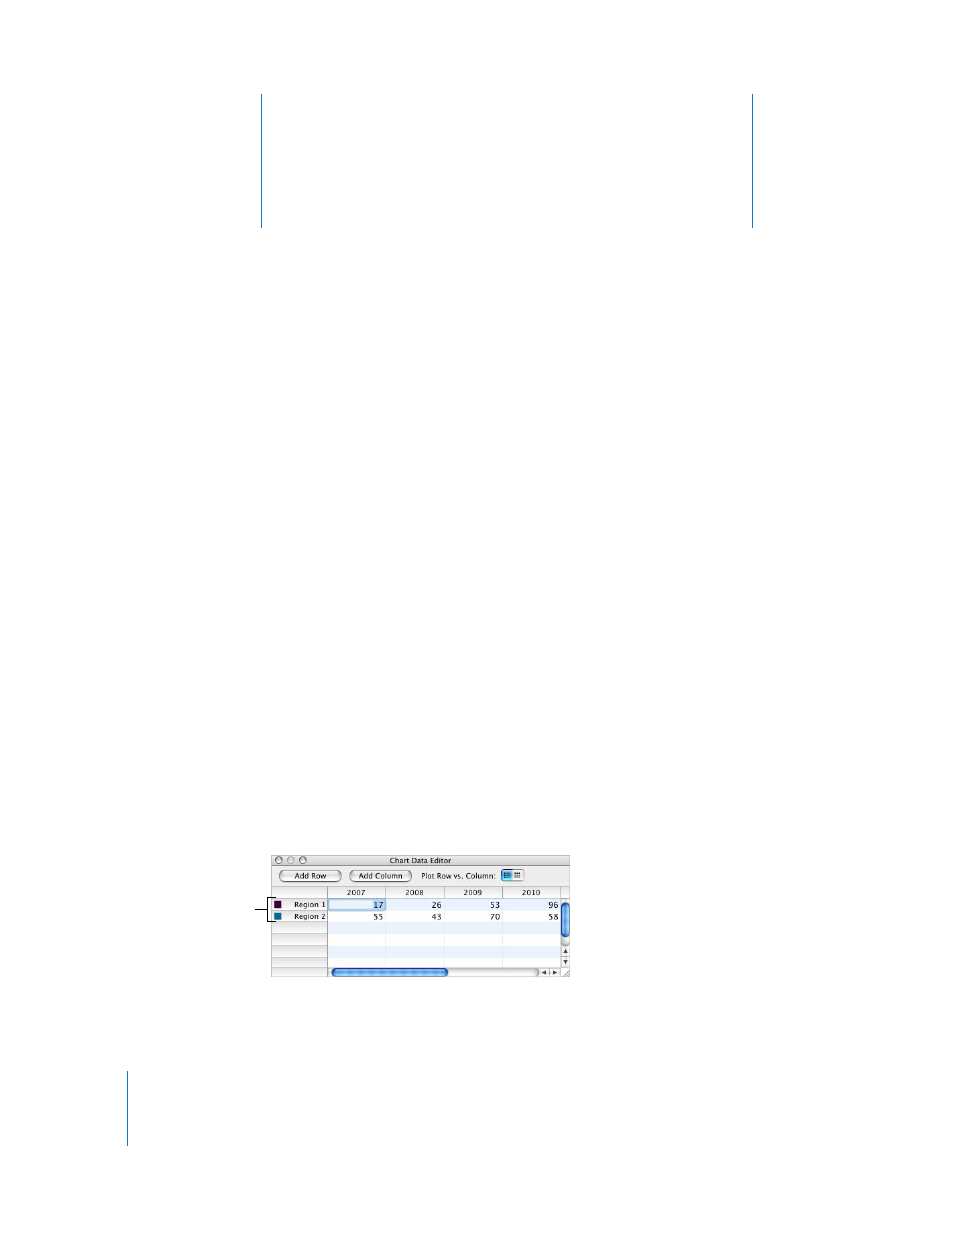
For example, you may want to create a chart that shows how many employees work in
Region 1 and Region 2 each year. Such a table might have two rows (one for Region 1
and one for Region 2) and four columns (one for each year from 2007 through 2010).
These squares indicate
which color represents
each data series.