Viewing server health status – Toshiba Magnia SG30 User Manual
Page 185
192
Managing the Server
Viewing server health status
5.375 x 8.375 ver 2.1
Viewing server health status
The Magnia SG30 has been integrated using high quality,
reliable components. You should not experience a problem
during the normal life of the unit. However, in the unlikely
case that there is a problem, the Magnia SG30 contains a
number of self-monitoring capabilities that allow the system
to detect potential problems before they permanently damage
the system. In this way, the system can help you identify
problems and get them resolved before the system crashes or
data is lost.The health monitoring subsystem (not availaible
in all countries) can be viewed using the Administration Web
site. A summary of your server’s health is displayed on the
default reports page when you first access this server Web
site.
Example of the System Status Report
This indicator will normally show that the Magnia SG30 is in
good health, as indicated above. If a problem is detected, the
bullet on the left will turn yellow, and the status will change
from “Good” to “Warning.”
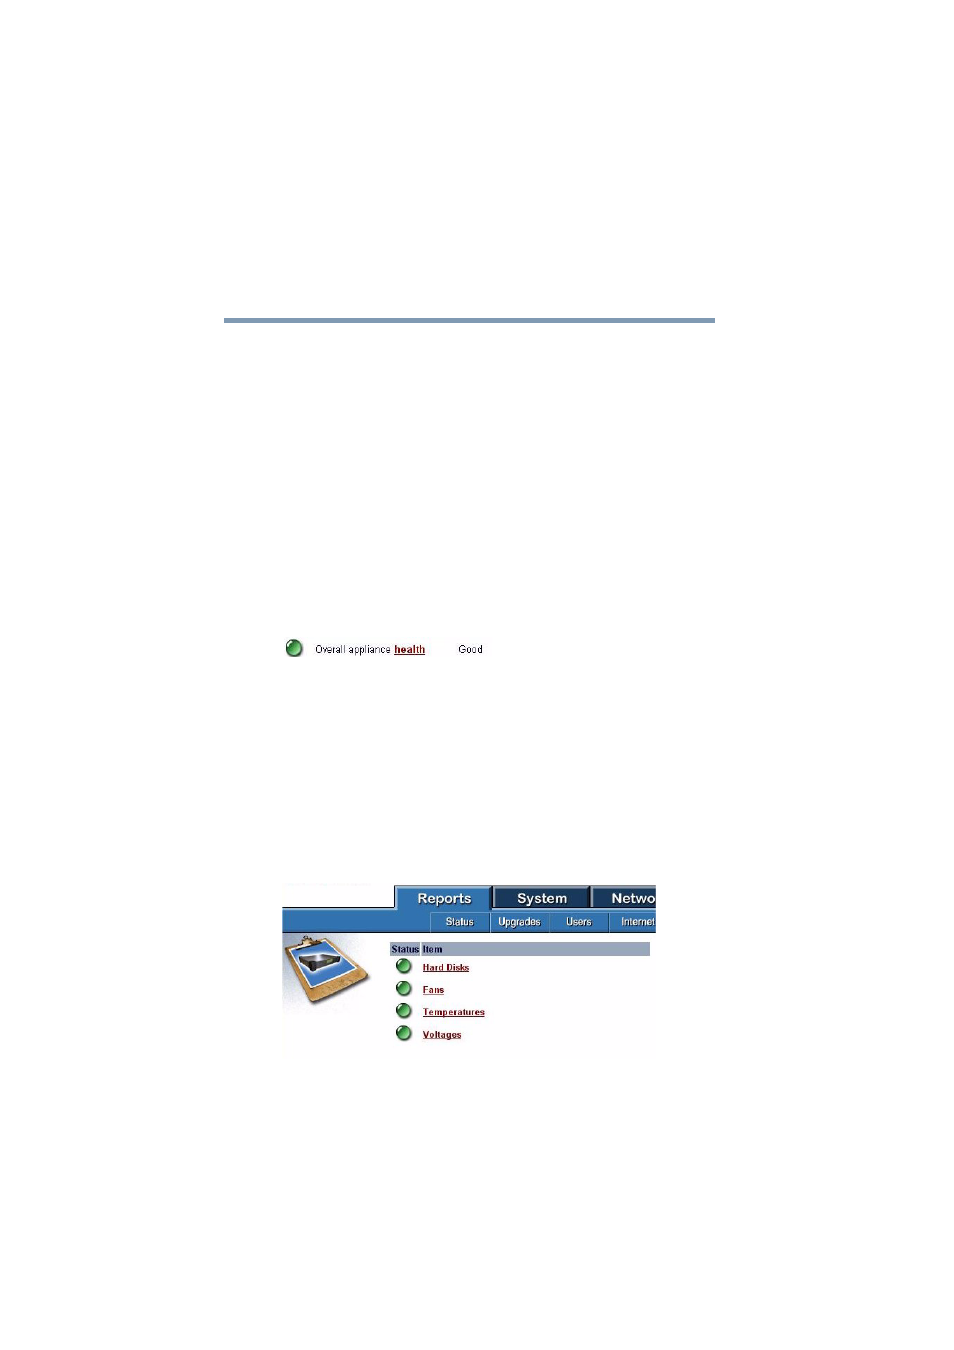
To view more detailed information about the server’s health,
and the types of status being monitored, select the Health
menu item in the Reports tab. A more detailed summary of
the system’s health will appear.
Example of the System Health Report