50 viewing_performance, Viewing performance over time – HP 3PAR Operating System Software User Manual
Page 275
50 Viewing_Performance
The InForm Management Console provides pre-defined performance charts for physical disk usage,
disk port, and host ports.
To view a pre-defined performance chart:
Procedure 6
1.
In the Manager Pane, click Performance.
2.
In the Management Tree, click either the Physical Disks or Ports (Data) node under the system
for which you wish to view performance.
3.
Click PD Usage - Total IOPS, Disk Ports - Total Throughput, or Hosts Ports - Total Throughput.
4.
Repeat steps 2 and 3 for any additional performance charts you wish to view.
A performance chart for each selected chart type is displayed in the Management window and
data collection and chart generation begins.
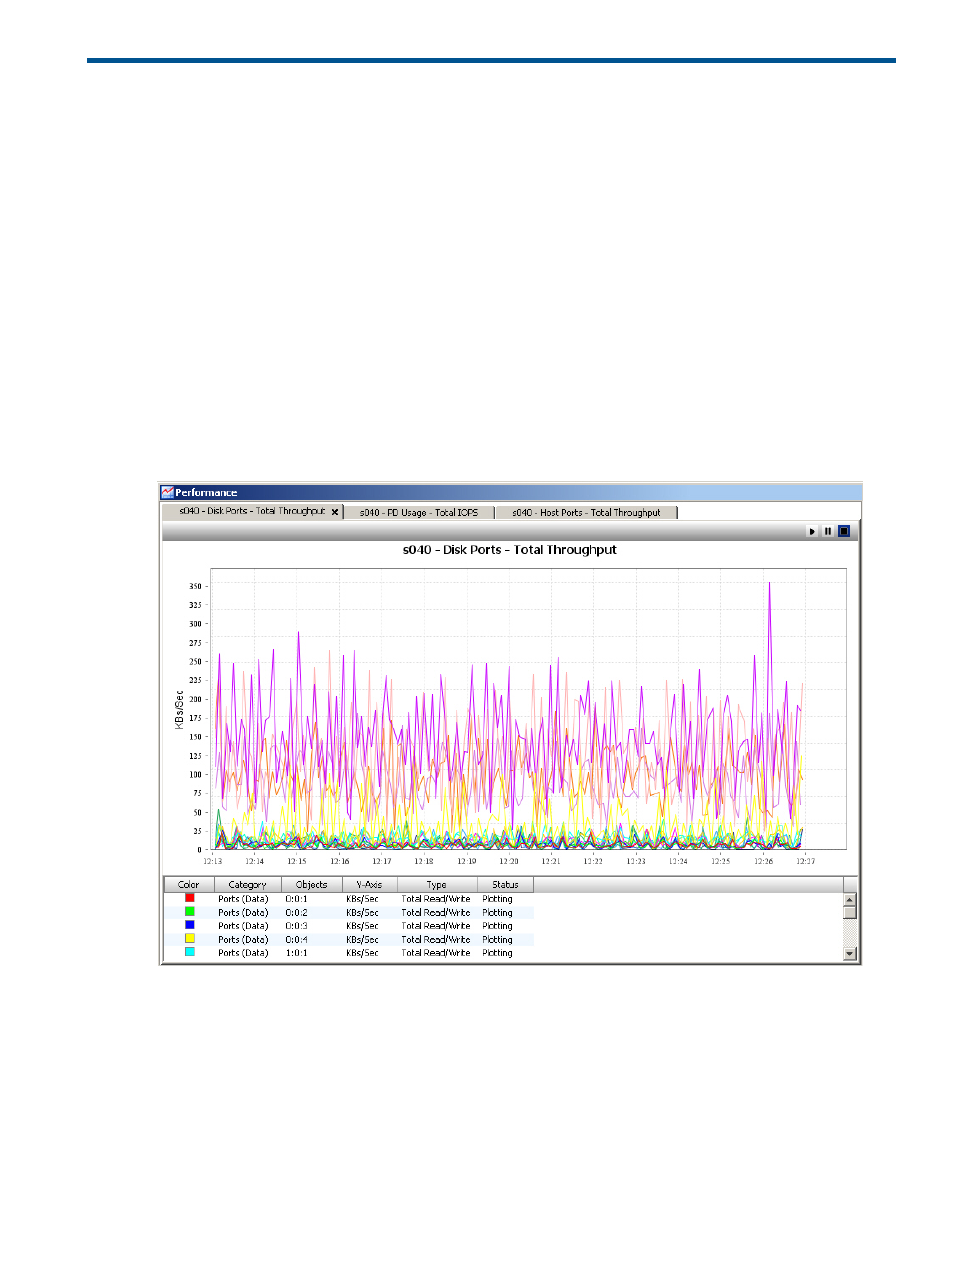
Viewing Performance Over Time
The Disk Ports and Host Ports charts display line graphs, which show performance over time.
Each started chart is tabbed at the top of the Management window. Simply click the tab for the
chart you wish to view.
At any time, you can use the controls at the upper right corner of each chart to pause or stop the
generation of the performance chart.
•
Pausing the chart will stop the plotting of data, but data collection will still occur in the
background.
•
Stopping the chart stops both data collection and plotting.
The lower pane of the chart provides a legend indicating color/plot association. Clicking a row
in the legend results in the corresponding plot becoming highlighted.
Viewing Performance Over Time 275