Average color tool results - rgb average – Banner PresencePLUS P4 COLOR Series User Manual
Page 173
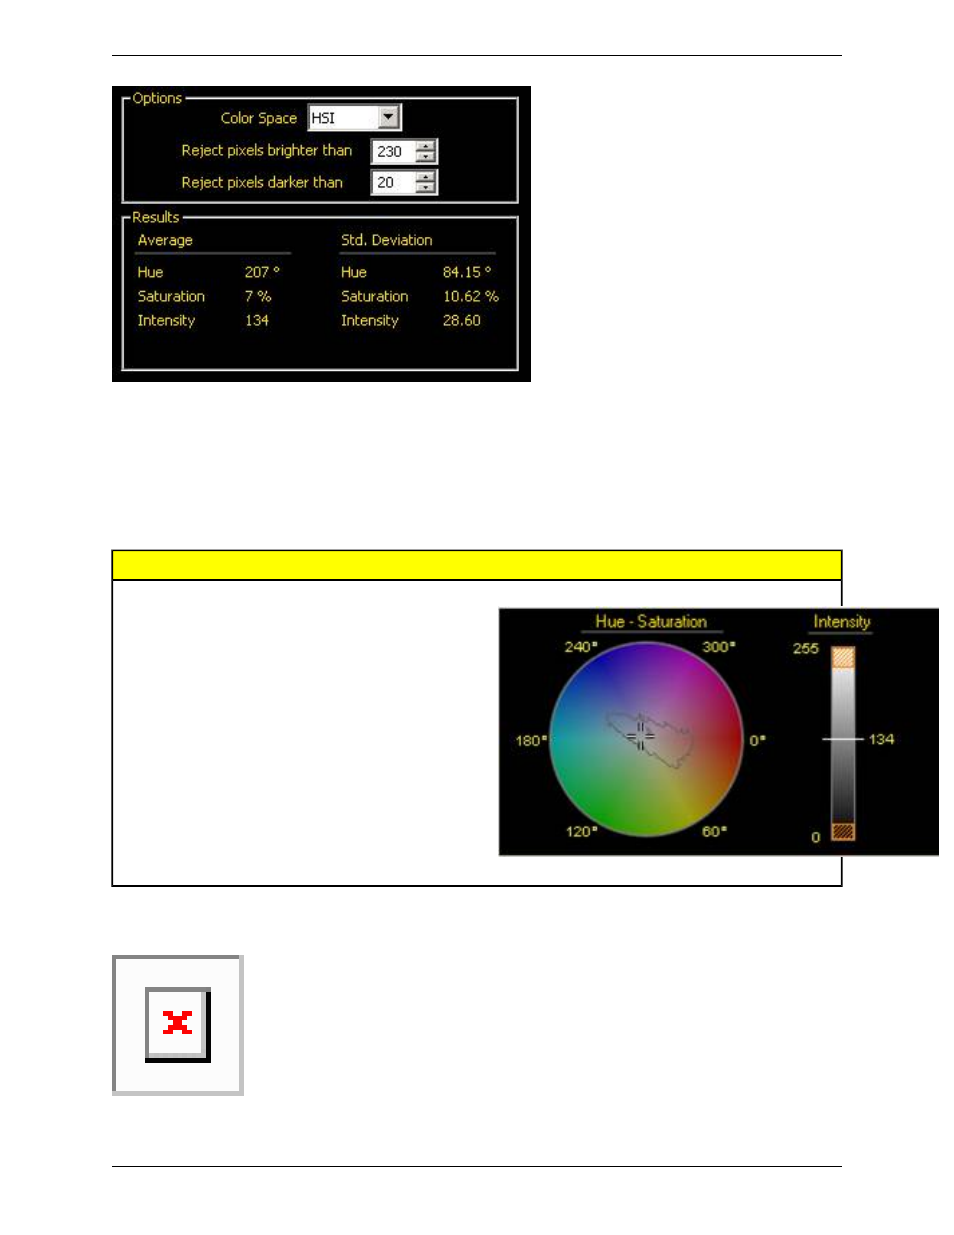
The table below describes the results and shows the color map. A color map is a visual legend showing the hue,
saturation, and intensity:
• Hue and Saturation are represented in the circular color map, while Intensity is shown as a gradient bar.
• The crosshairs indicate the average hue and saturation, and the line on the intensity bar shows the average intensity.
• The irregular outline in the color map includes all the individual colors represented in the ROI from which the average
color is derived.
HSI Color Map
Description
Value
A representation of average hue as an angle
in degrees around a circle, which will always
be between 0 and 359°.
Hue
A representation of average saturation as a
distance from the center of the circle where
0 is the center of the circle (and could include
the colors black, white and gray) and 100
would be on the very edge of the color map
circle. With a higher saturation number, the
color represented is more vivid.
Saturation
The average brightness of a color, represented
in a number from 0 (black) to 255 (white).
Intensity
Average Color Tool Results - RGB Average
Red : The average of the red color component, represented as a number from 0 to 255. Fully saturated red is a [255,
0, 0].
173
Minneapolis, MN USA
Banner Engineering Corp.
PresencePLUS Software Tools
2/2010