Filters – Banner PresencePLUS P4 COLOR Series User Manual
Page 146
Graph Tab
When Edge Strength is selected in the Input tab, the software displays the Graph tab. This tab provides similar
information to the Input tab, but displays separate Edge Profile and Edge Strength graphs for easier viewing.
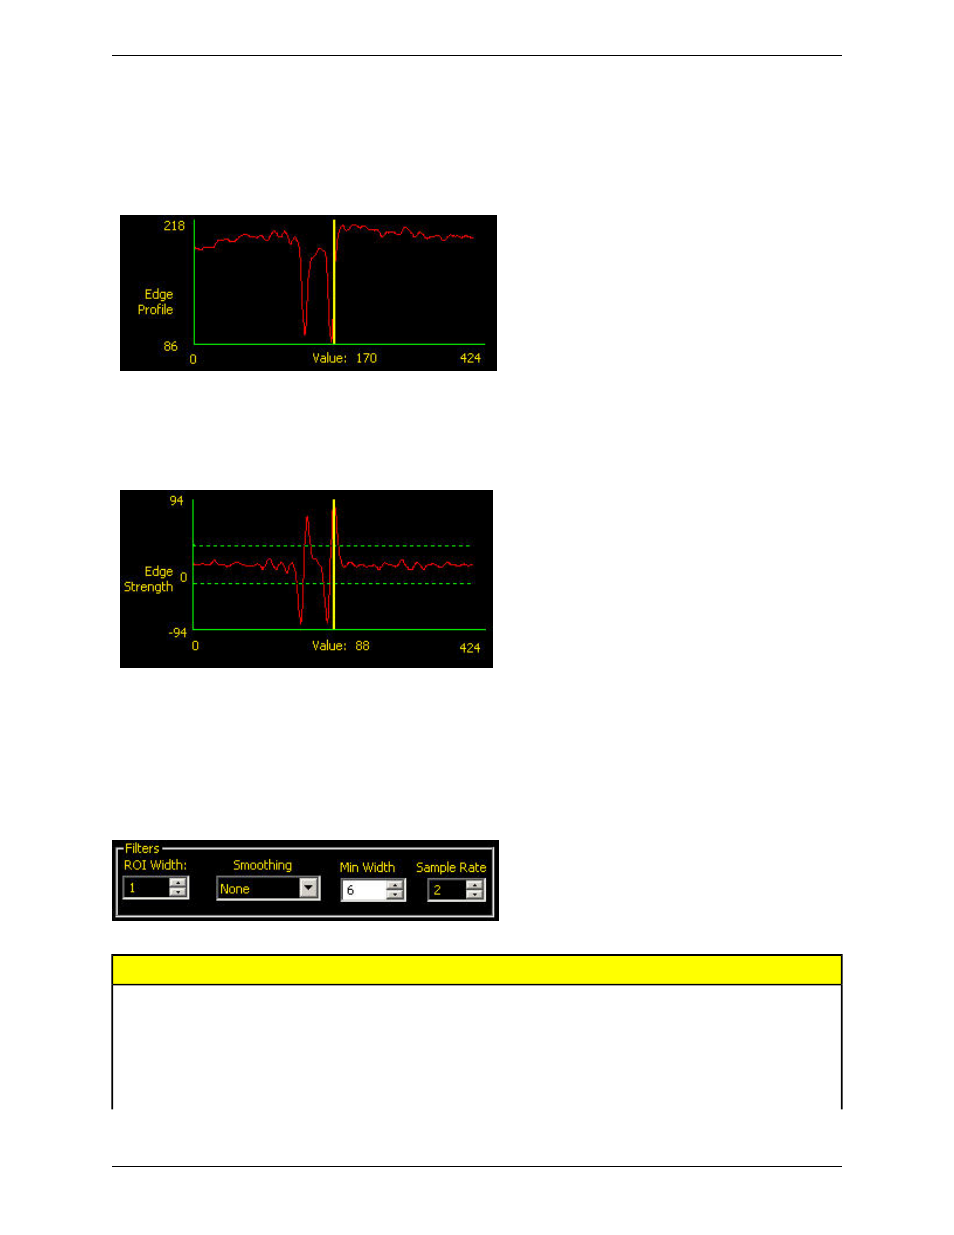
The Edge Profile graph represents the absolute gray scale level across the tool ROI.
The Edge Strength graph represents the change in gray scale along the tool ROI. Edge Strength detects an edge when
the rate of change (solid red line on the graph) crosses the selected intensity change amount (dashed green lines on
the screen).
A bright-to-dark transition has a negative edge strength value, and a dark-to-bright transition has a positive edge
strength value. When the Edge Strength level is adjusted, both the negative and positive green dotted lines will adjust
together.
Filters
Description
Field
Increases in increments of 4 pixels (for example, 1, 5, 9, 13, ...) up to the total
FOV size. Some things to note:
ROI Width
• Narrow ROIs execute faster but could miss the edge.
• Wide ROIs are more consistent but don't execute as fast.
• The ROI must be 13 pixels or wider to calculate the rotation of a part.
Banner Engineering Corp.
Minneapolis, MN USA
146
2/2010
PresencePLUS Software Tools