Histogram, Blob detect tool advanced tab – Banner PresencePLUS P4 COLOR Series User Manual
Page 132
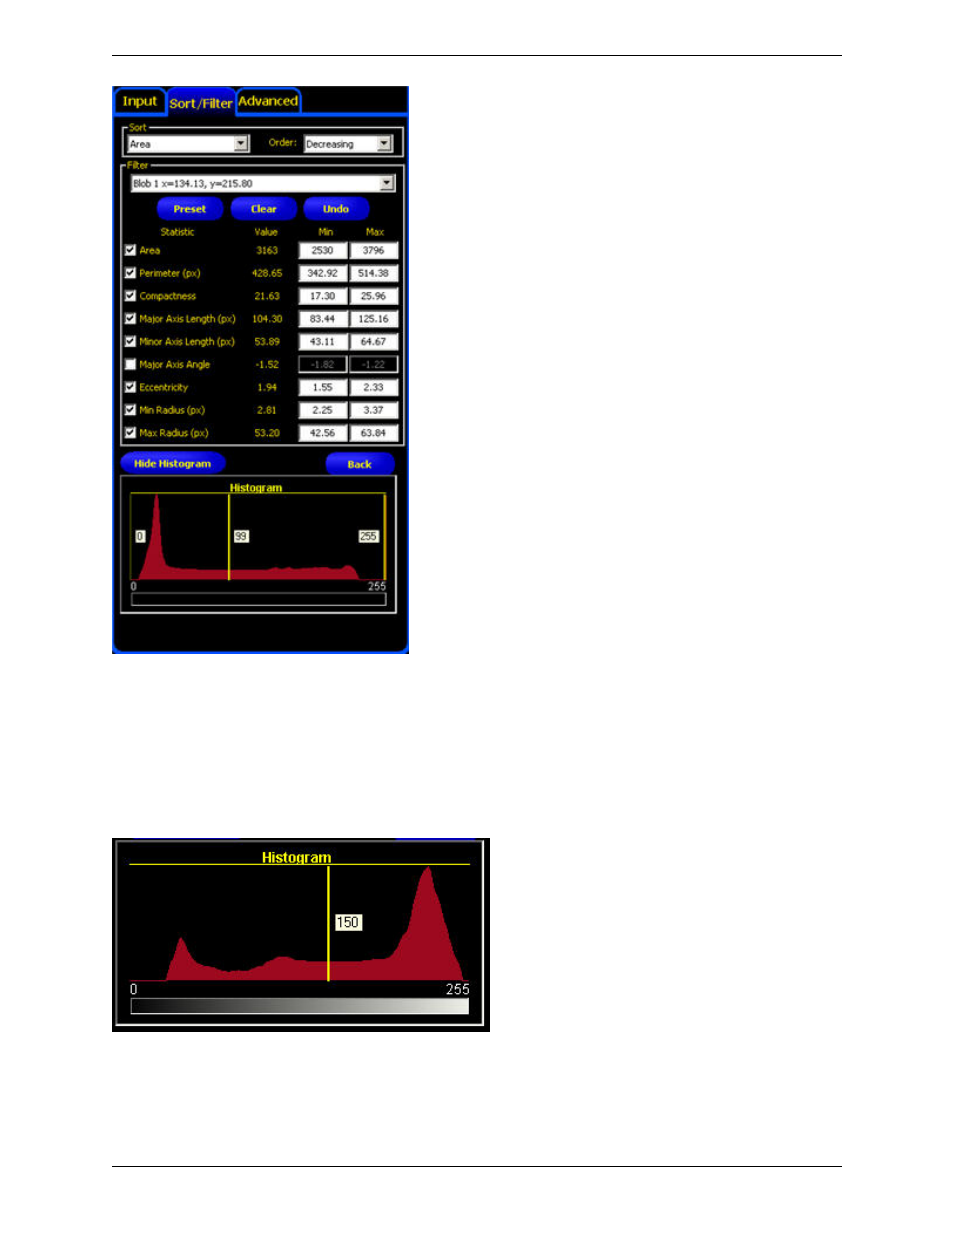
Histogram
The Histogram is a display of the grayscale values on the "x" axis and the number of pixels on the "y" axis. The
Histogram displays the amount of pixels for each grayscale value. The graph displays information for all grayscale
values (0-255). Cursors, shown as vertical lines, represent minimum threshold, maximum threshold, threshold level
and reject level. Corresponding cursor can be moved horizontally to adjust a value.
Blob Detect Tool Advanced Tab
Fields
Banner Engineering Corp.
Minneapolis, MN USA
132
2/2010
PresencePLUS Software Tools
This manual is related to the following products: