Teledyne LeCroy Merlin II - Users Manual User Manual
Page 165
155
Merlin II Protocol Analyzer User’s Manual
CATC
SW Version 2.50
Real-Time Statistics Buttons
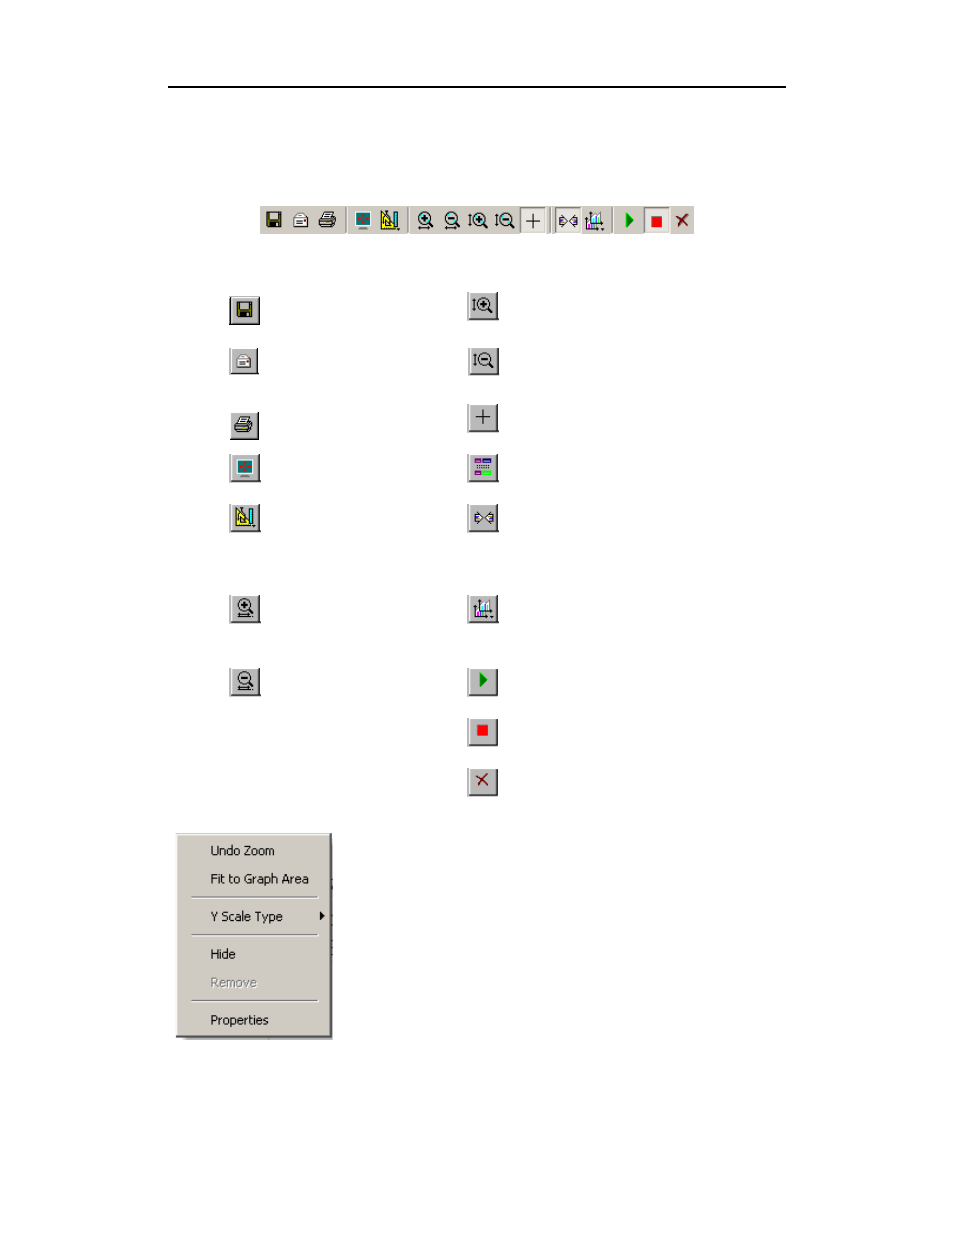
The Real-Time Statistics toolbar has buttons for changing the format of the
displayed data and for exporting data:
The buttons have the following functions:
Real-Time Statistical Monitor Pop-up Menu
If you right-click a graph in the Real-Time window, a
pop-up menu will appear with options for changing the
format of the display.
Undo Zoom - If you have zoomed in, this command will
undo the zoom.
Fit to Graph Area - Redisplays graph so that the entire
trace fits inside graph area.
Y Scale Type -·
Linear - Converts display to linear format.
Save As - Saves Real-Time
graphs as bitmap files
(*.bmp)
Vertical zoom in
Email - Creates an email
with a *.bmp file attachment
of the graphs
Vertical zoom out
Click and Drag zoom - Click diagonally to
select and zoom in on part of the graph
Full Screen
Select Range
View Settings - opens a
sub-menu with options for
formatting the display.
Sync and Graph areas - If two or more
graphs are displayed, this button will
synchronize the graphs to one another. Once
synchronized, the positioning slider of one
graph will move the other graphs
Horizontal zoom in
Graph Areas - Presents options for
displaying additional graphs of data lengths,
packet lengths, and percentage of bus
utilized.
Horizontal zoom out
Start. Starts the Real-Time Monitor.
Stop Real-Time Monitoring.
Reset. Resets the graphs.