5 bus utilization, Bus utilization – Teledyne LeCroy Merlin II - Users Manual User Manual
Page 159
149
Merlin II Protocol Analyzer User’s Manual
CATC
SW Version 2.50
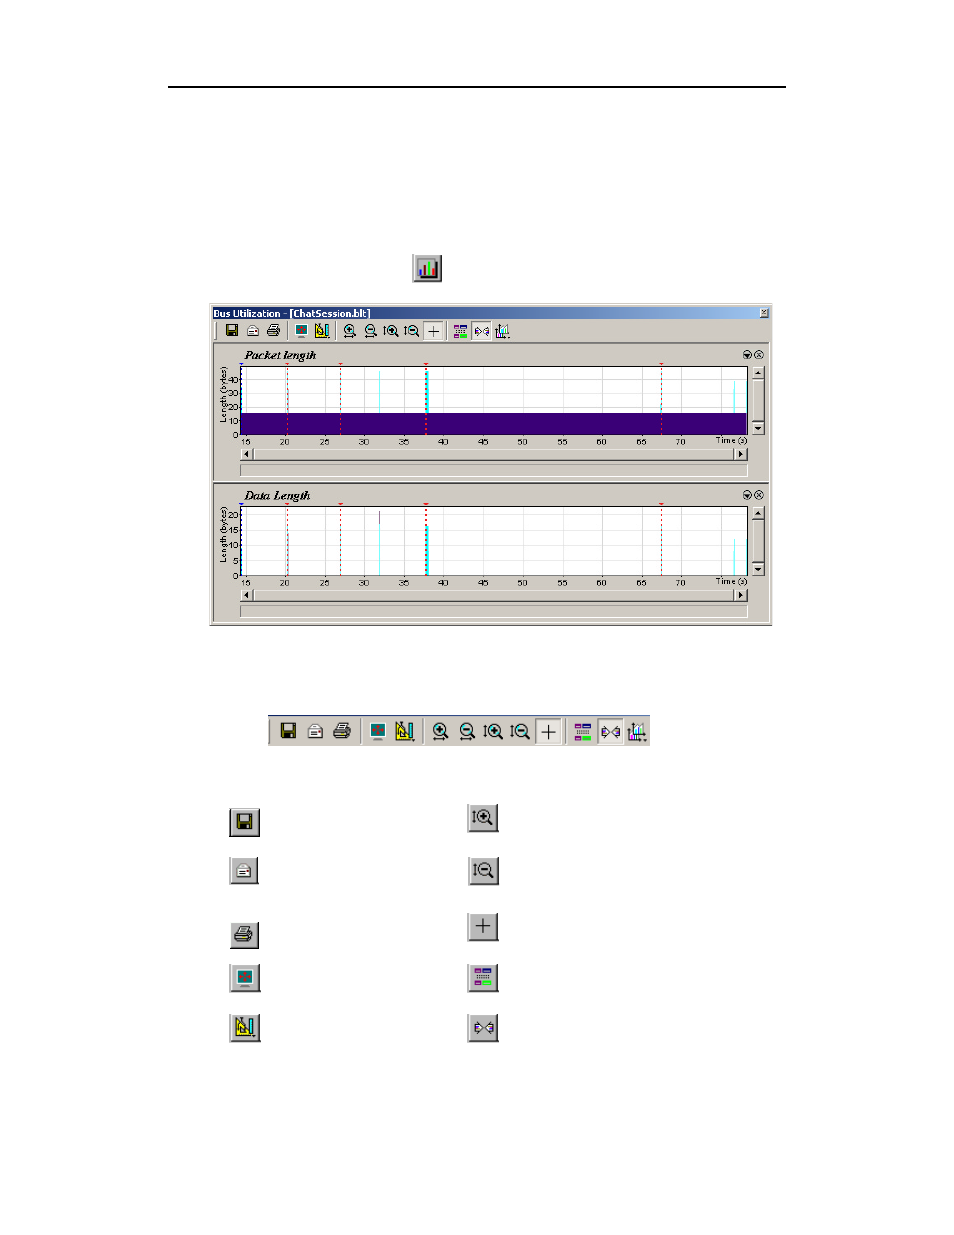
11.5 Bus Utilization
The Bus Utilization window displays a graph of bandwidth use within a
displayed trace.
To open the Bus Utilization window, select Report >Bus Utilization or
click the button marked
. A window will open with graphs of Link
Utilization, Data Throughput, and Packet Counts:
Bus Utilization Buttons
The Bus Utilization window has a row of buttons for changing the format of
the displayed data and for exporting data:
The buttons have the following functions:
Save As - Saves the graphs
as a bitmap file (*.bmp)
Vertical zoom in
Email - Creates an email
with a *.bmp file attachment
of the graphs
Vertical zoom out
Click and Drag zoom - Click diagonally to
select and zoom in on part of the graph
Full Screen
Select Range
View Settings - opens a
sub-menu with options for
formatting the display. See
“View Settings Menu”
below.
Sync and Graph areas - If two or more
graphs are displayed, this button will
synchronize the graphs to one another. Once
synchronized, the positioning slider of one
graph will move the other graphs