Teledyne LeCroy Merlin II - Users Manual User Manual
Page 164
154
Merlin II Protocol Analyzer User’s Manual
CATC
SW Version 2.50
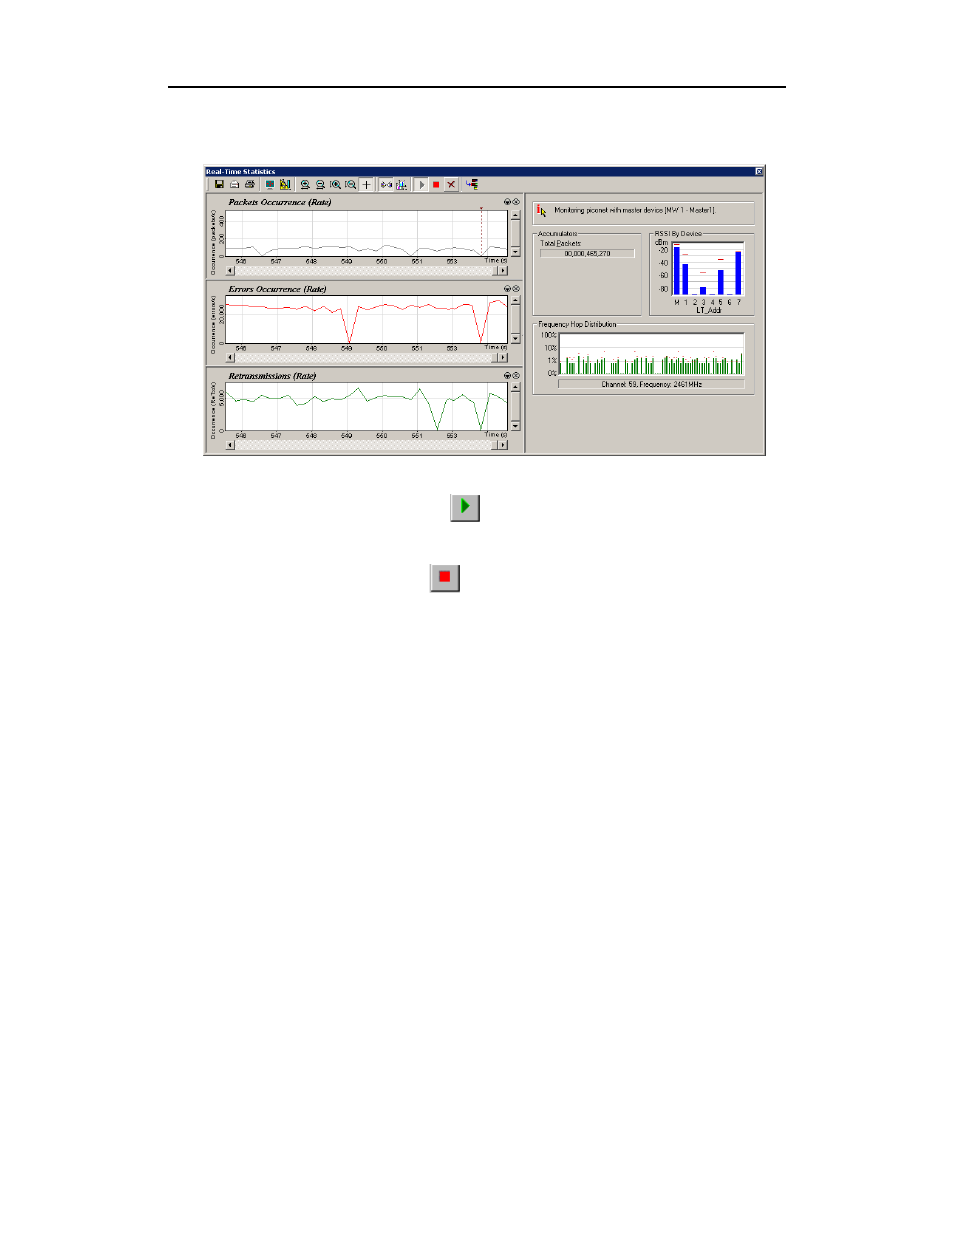
The Real Time Statistics window opens:
In order to see a graph of traffic, you will need to start recording. After
starting piconet activity, press
to start the Real-Time statistics monitor.
Merlin II will then synchronize to the piconet and stream data in real time
to this window and presented in a format of your choice.
To stop the monitor, press
.
The Real-Time Statistics window is divided into two main areas:
Left-side - Displays time-domain graphs.
Right-side - Displays general statistics and additional information
including a bar graph that displays the averaged RSSI readings per device
(LT_Addr). This graph is updated periodically only when the analyzer is
synced to a piconet.
The General Statistics area presents the following information:
• Status of the system (whether the analyzer is synched, and what
device is monitored).
• ‘Total Packets’ counter that counts the total number of captured
packets from the point the RTS started running.
• ‘RSSI measurements’ – bar graph that shows the averaged RSSI
measurements per device in the piconet that is monitored.
• ‘Frequency Hop Distribution’ – An histogram bar that shows the
distribution of actual hops by the frequency channel. Note that
this graph is logarithmic.
As in the case of the time-domain graphs, the General Statistics display can
be reset through the ‘Reset graphs’ button.