Ipi numeric view, Ipi trend graph view, Set up ipi – Welch Allyn 6000 Series Connex Vital Signs Monitor - User Manual User Manual
Page 120
The frame provides a numeric view and a graphical trend view of IPI data. You can toggle
between views by touching the left side of the frame.
IPI numeric view
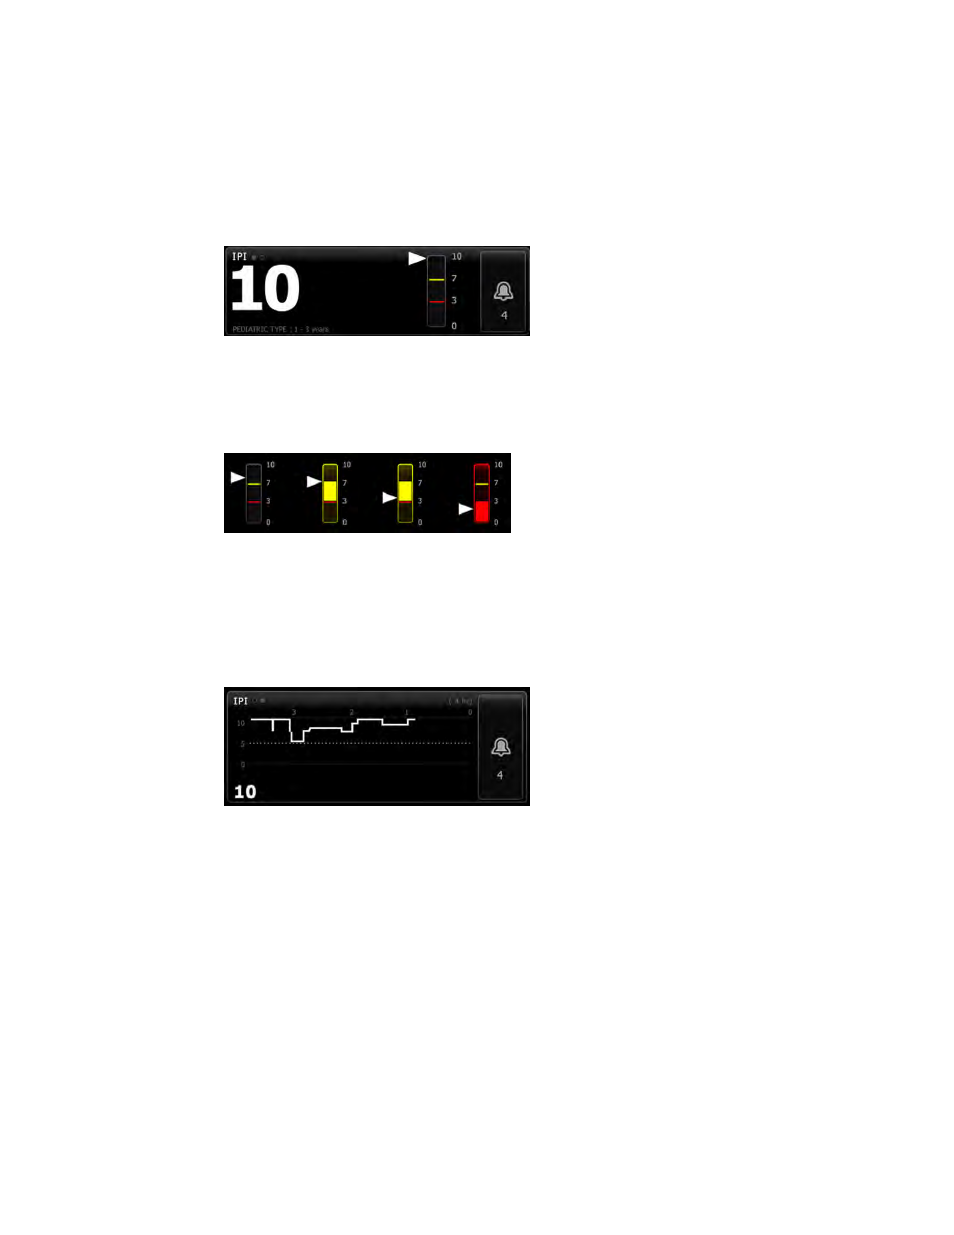
This view displays the numeric value for the integrated parameters.
The numeric view also includes a graphic indicator of the patient's current IPI value. As
shown in the examples below, when the IPI value is 8, 9, or 10, the outline of the vertical
bar is gray. When the IPI value is 4, 5, 6, or 7, the outline of the bar is yellow, and the
middle section of the bar is shaded yellow. When the IPI value is 1, 2, or 3, the outline of
the bar is red, and the lowest section of the bar is shaded red.
IPI trend graph view
This view presents a graph of the IPI numeric values over a user-selected period and
thus can alert you to changes in the patient's respiratory status. In Advanced settings,
you can select the period displayed.
The size of the IPI frame and displayed trend data varies based on your configuration.
The graph shows the IPI value on the y-axis and time on the x-axis (oldest calculations on
the left and newest calculations on the right). IPI values update once every second.
Set up IPI
Follow these steps to configure IPI parameter options.
1. Touch the Settings tab.
2. Touch the Setup tab.
3. Touch the IPI vertical tab.
4. Adjust the Trend period as desired. You can set the default in Advanced settings.
5. Touch the Home tab.
The new settings take effect immediately.
6. Touch the patient type control on the right side of the Patient frame.
The Patient Summary tab appears.
114 Patient monitoring
Welch Allyn Connex
®
Vital Signs Monitor 6000 Series™