Creating advanced performance monitoring graphs, Creating an sid/did performance graph, Figure 43 creating an sid/did performance graph – HP Brocade 4Gb SAN Switch for HP BladeSystem c-Class User Manual
Page 123: 43 creating an sid/did performance graph, Creating an sid/did, Performance graph
Fabric OS 5.0.0 Advanced Web Tools user guide 123
Creating advanced performance monitoring graphs
You can create the advanced performance monitor graphs listed in
. Because the procedure for
creating these graphs differs depending on the type of graph, each type is described separately in the
sections that follow.
NOTE:
You must have an Advanced Performance Monitoring license installed to use the Advance
Performance Monitor features.
Creating an SID/DID performance graph
The SID/DID performance graph displays the traffic between a SID/DID pair on the switch being
managed. To create a SID/DID performance graph:
1.
Launch the Performance Monitor module as described on
.
2.
Select Performance Graphs > Advanced Monitoring > SID/DID Performance.
The SID/DID Performance Setup dialog box opens (
).
If you want to see which end-to-end (EE) monitors are currently set up on a particular port, proceed to
If you want to specify the port, source ID, and domain ID, skip to
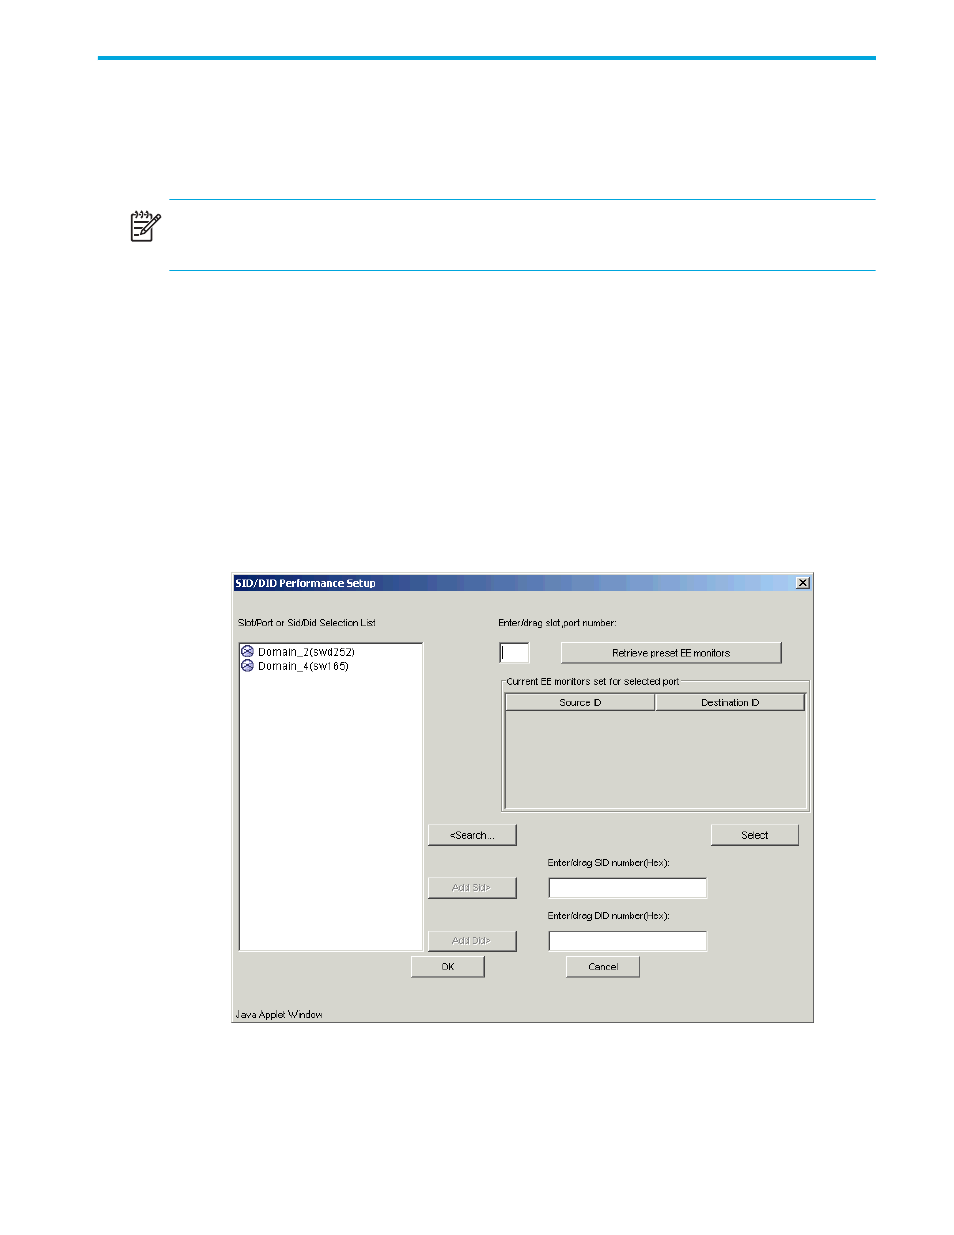
Figure 43
Creating an SID/DID performance graph
3.
Click a port from the Slot/Port or Sid/Did Selection List.
a. Drag the selected port into the Enter/drag port number field.
b. Click Retrieve preset EE monitors.