User-defined graphs, Canvas configurations, Launching the performance monitor module – HP Brocade 4Gb SAN Switch for HP BladeSystem c-Class User Manual
Page 120: Creating a basic performance monitor graph, 40 canvas of eight performance monitoring graphs
120 Performance monitoring administration
User-defined graphs
You can modify the predefined graphs to create your own customized graphs (see ”
” on page 121 for more information). These user-defined graphs can be added and
saved to canvas configurations, as described on
Canvas configurations
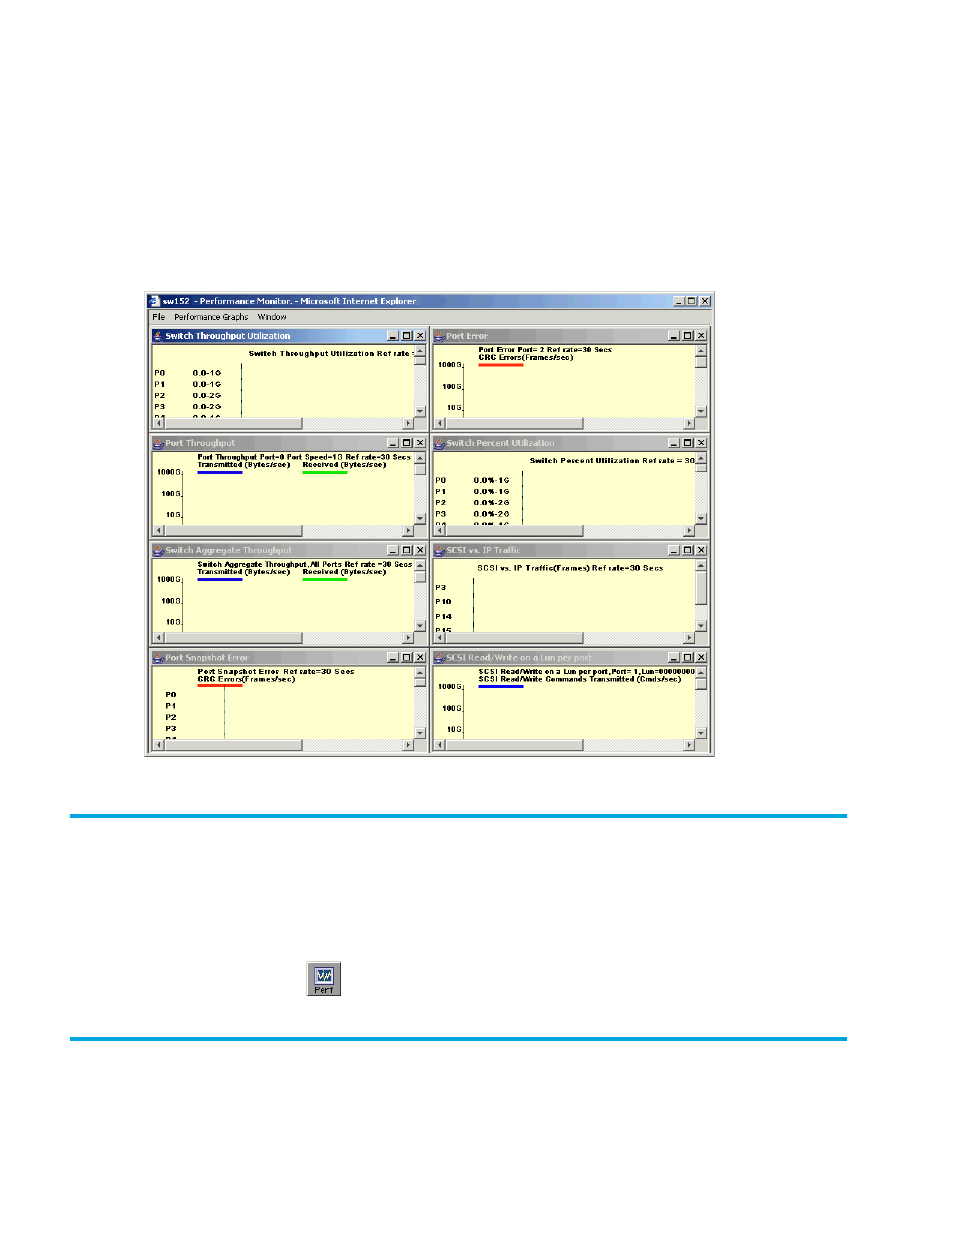
A canvas is a saved configuration of graphs. The graphs can be either the Advanced Web Tools
predefined graphs or user-defined graphs. Each canvas can hold up to eight graphs per window, as
shown in
. Up to 20 canvases can be set up for different users or different scenarios. Each
canvas is saved with a name and an optional brief description.
Figure 40
Canvas of eight performance monitoring graphs
Launching the Performance Monitor module
Use the following procedure to launch the Performance Monitor module:
1.
Select a switch from the Fabric Tree.
The selected switch appears in the Switch View.
2.
Click the Perf button
from the Switch View.
The Performance Monitor module opens.
Creating a basic Performance Monitor graph
To create the basic performance monitor graphs listed in
1.
Launch the Performance Monitor.