6 show statistics: line chart, Figure 10 home > show statistics, Table 6 home > show statistics – ZyXEL Communications NBG410W3G User Manual
Page 55

Chapter 2 Introducing the Web Configurator
NBG410W3G Series User’s Guide
55
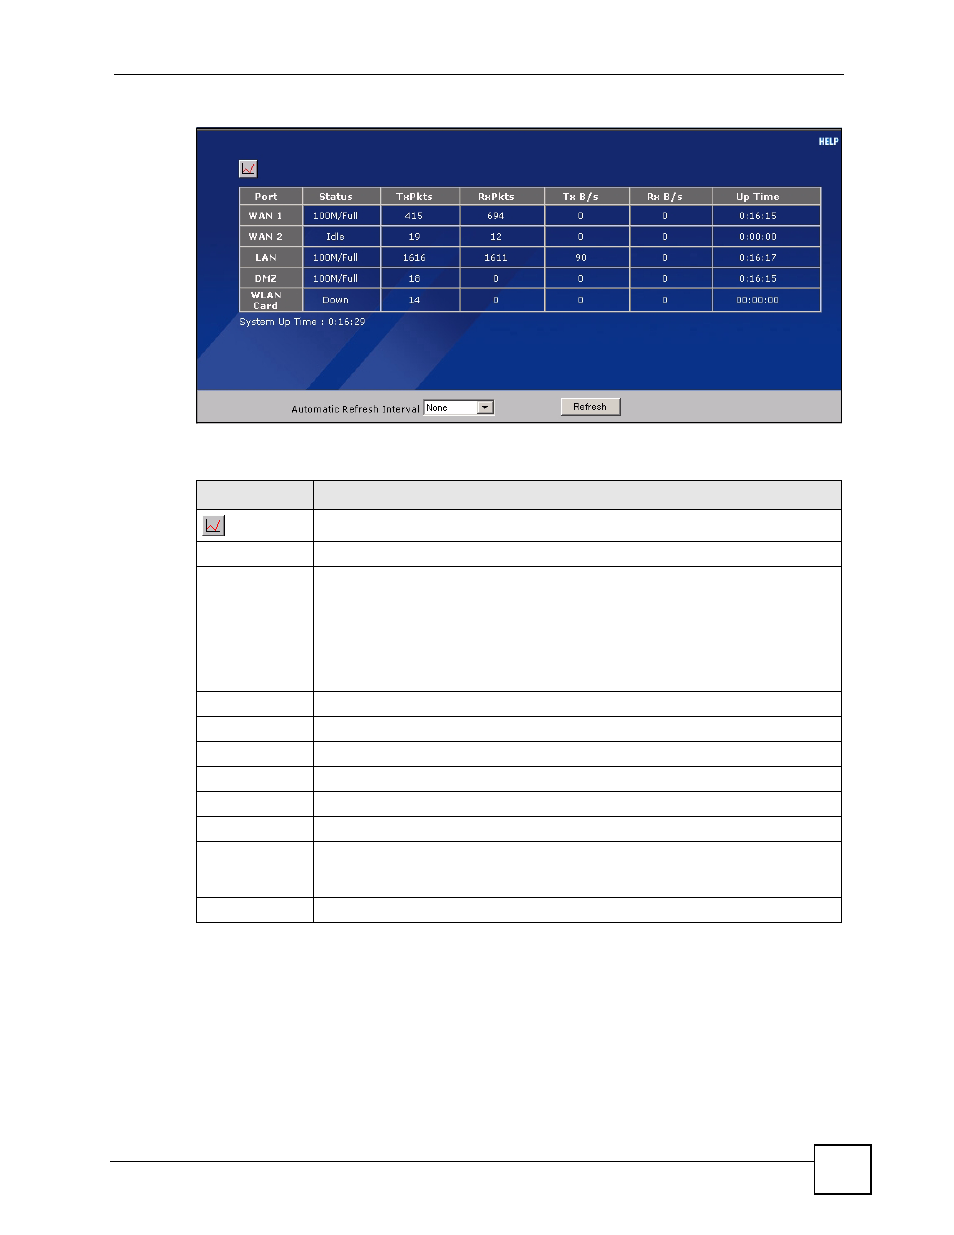
Figure 10 HOME > Show Statistics
The following table describes the labels in this screen.
2.4.6 Show Statistics: Line Chart
Click the icon in the Show Statistics screen. This screen shows you a line chart of each port’s
throughput statistics.
Table 6 HOME > Show Statistics
LABEL
DESCRIPTION
Click the icon to display the chart of throughput statistics.
Port
These are the ZyXEL Device’s interfaces.
Status
For the WAN interface(s), this displays the port speed and duplex setting if you’re
using Ethernet encapsulation or the remote node name for a PPP connection and
Down (line is down or not connected), Idle (line (ppp) idle), Dial (starting to trigger a
call) or Drop (dropping a call) if you’re using PPPoE encapsulation.
For the LAN or DMZ ports, this displays the port speed and duplex setting.
For the Wi-Fi card, this displays the transmission rate when Wi-Fi is enabled or
Down when Wi-Fi is disabled.
TxPkts
This is the number of transmitted packets on this port.
RxPkts
This is the number of received packets on this port.
Tx B/s
This displays the transmission speed in bytes per second on this port.
Rx B/s
This displays the reception speed in bytes per second on this port.
Up Time
This is the total amount of time the line has been up.
System Up Time This is the total time the ZyXEL Device has been on.
Automatic
Refresh Interval
Select a number of seconds or None from the drop-down list box to update all
screen statistics automatically at the end of every time interval or to not update the
screen statistics.
Refresh
Click this button to update the screen’s statistics immediately.
