2 changing displayed items, Screen 1 screen 2 screen 3, Lower row: max. demand value recorded so far – KYORITSU 6300 Instruction Manual User Manual
Page 105
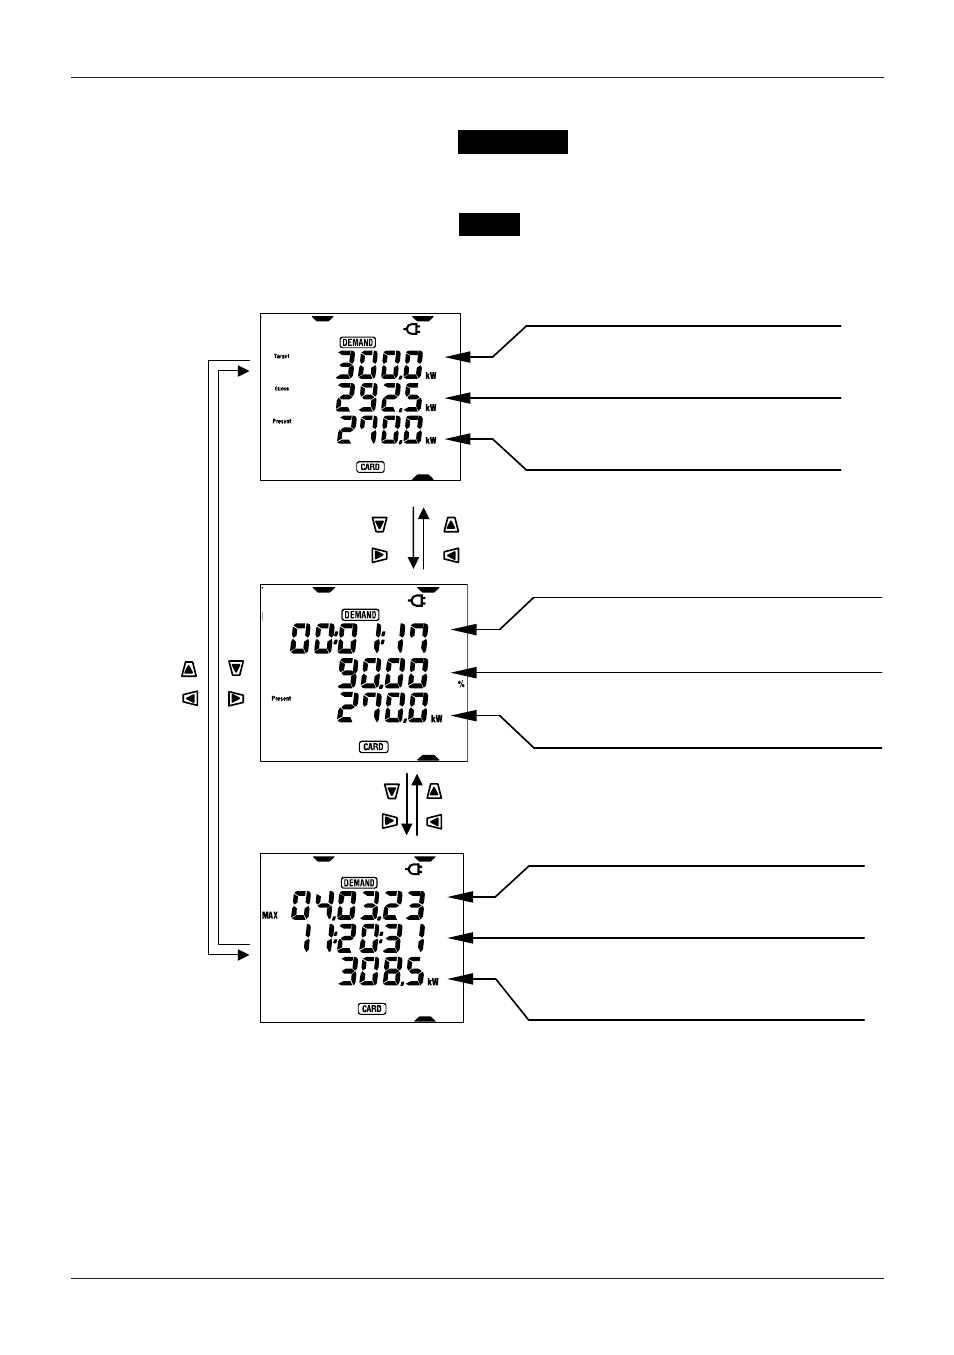
8-2 Changing displayed items
There are 3 display screens on
DEMAND
range, and the screens are
common to each wiring configuration.
Ɣ Screens can be changed with
Cursor
keys as follows.
‣ ‧ • ⁈ ‥ • • ⁈ • • ⁈
‣ ⁂ ․ ⁉ ‣ ⁂ ‥ ⁉ ‥ ⁂‥ ⁉ ‥ ⁂… ⁉
‧ ″
‣ • ″
․ • ″
‧ • ″
‣ • • ″ ․ • • ″ ‧ • • ″ ‣ • • • ″
Middle row: Predicted demand value
Upper row: Target demand value
Lower row: Present demand value
‣ ‧ •⁈ ‥ •• ⁈ • •⁈
‣ ⁂․
⁂․ ⁉ ‣ ⁂‥
⁂‥ ⁉ ‥ ⁂‥
⁂‥ ⁉ ‥ ⁂…⁉
‧″
‣• ″
․ •″
‧ • ″
‧ • ″
‣ • •
‣ • •″ ․ • •
• •″ ‧• • ″
• • ″ ‣ • •
• •• ″
• ″
Middle row: Load factor
Upper row: Remaining time for demand
interval elapse
Lower row: Present demand value
‣ ‧ • ⁈ ‥ • • ⁈ • • ⁈
‣ ⁂․ ⁉ ‣ ⁂‥ ⁉ ‥ ⁂‥ ⁉ ‥ ⁂… ⁉
‧ ″
‣ • ″
․ • ″
‧ • ″
‣ • • ″ ․ • • ″ ‧ • • ″ ‣ • • • ″
Upper row: Date when the max. demand
was recorded (year/ month/ day)
Lower row: Max. demand value
recorded so far
or
or
Screen 1
Screen 2
Screen 3
Middle row: Time when the max. demand
measured (hour/ minute/ second)
8. 7
MODEL6300
Section 8 Demand value measurement
MODEL6300