3 expanded metrics header display, 17 show metrics in the traffic summary window, 1 reports at split transaction level – Teledyne LeCroy Summit T3-16 PCIe Multi-lane Protocol Analyzer User Manual User Manual
Page 223

Summit T3‐16 PCI Express Multi‐Lane Protocol Analyzer User Manual
211
Show Metrics in the Traffic Summary Window
Teledyne LeCroy
10.16.3 Expanded Metrics Header Display
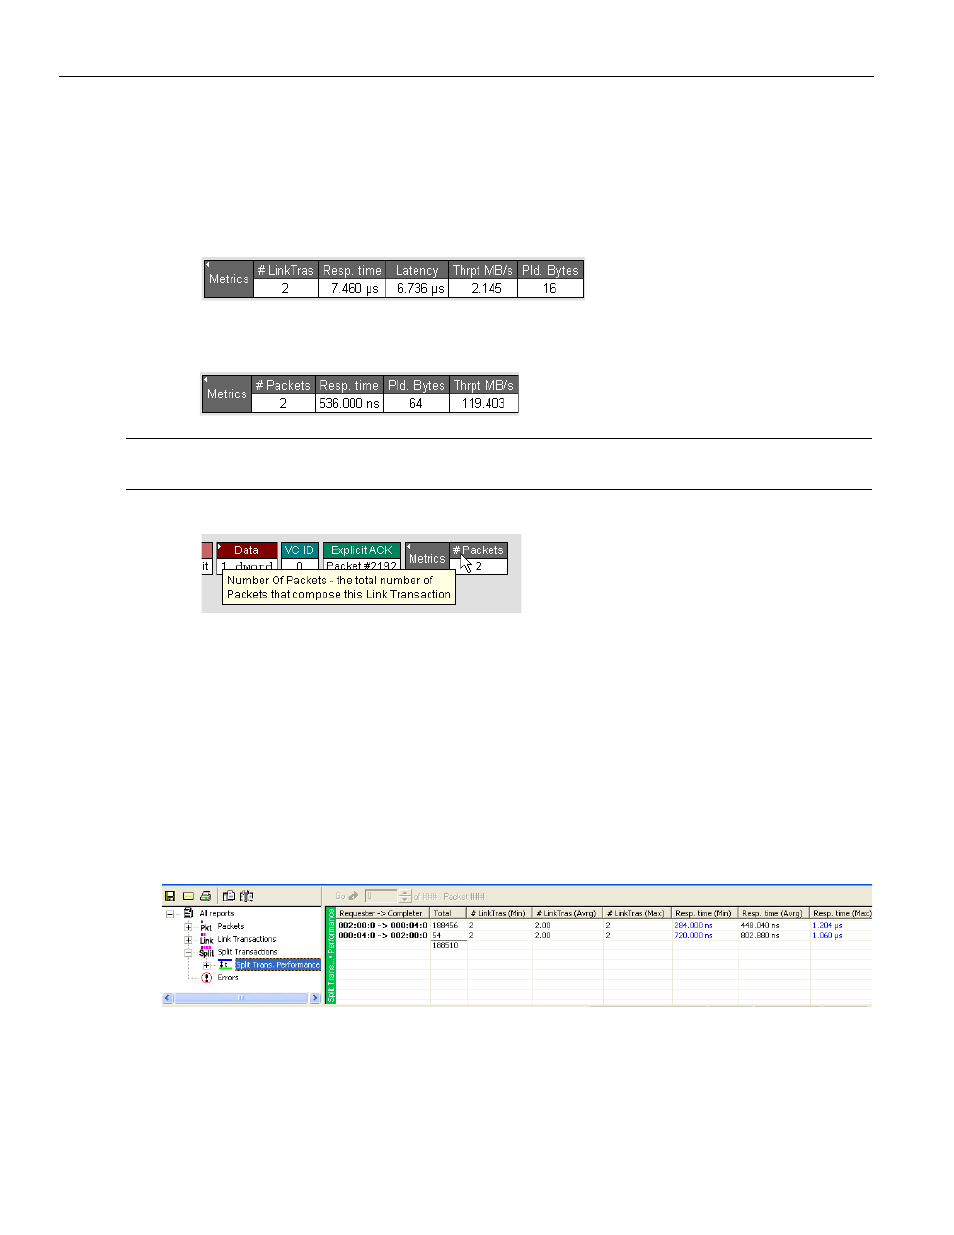
When you expand the Metrics header, the display creates a separate cell for each
applicable metric:
The following is the expanded Metric header for a unit in the Split Transaction view.
The following is the expanded Metric header for a unit in the Link Transaction view.
Note:
Each of the metric cells pops up a tool tip window with the explanation of what the metric
means.
10.17 Show Metrics in the Traffic Summary Window
Some of the Traffic Summary reports at the Link and Split Transaction levels are based on
metrics collected for the corresponding protocol units in the CATC Trace.
10.17.1 Reports at Split Transaction Level
Split Transaction Performance: This report table groups the Split Transactions by
Requester‐Completer pair and displays Minimum/Average/Maximum data for Number Of
Link Transactions and Response Time metrics.
Read Requests Performance: This report table includes only the Split Transactions that
present Read Requests (Configuration, IO and Memory). It groups them by the
combination of Requester‐Completer pair, request type, and Traffic Class and displays
Minimum/Average/Maximum data for Throughput, Response Time, and Latency metrics
(see the following figure).
