5 link tracker, 1 using the link tracker window – Teledyne LeCroy Summit T3-16 PCIe Multi-lane Protocol Analyzer User Manual User Manual
Page 204
Teledyne LeCroy
Link Tracker
192
Summit T3‐16 PCI Express Multi‐Lane Protocol Analyzer User Manual
10.5 Link
Tracker
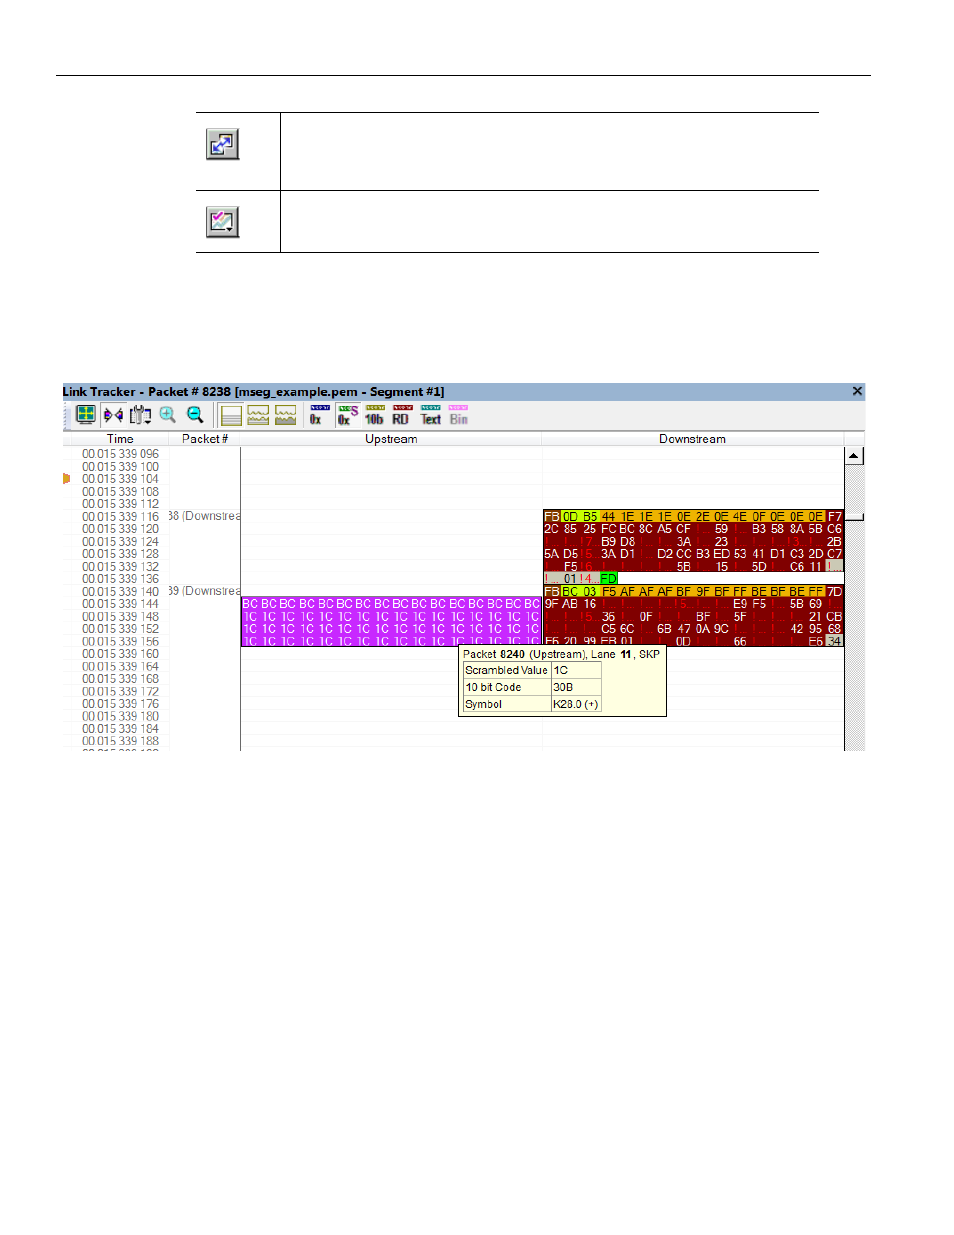
The Link Tracker window displays a detailed chronological view of events. Events are
shown on a channel‐by‐channel basis in columns within the window.
Figure 10.15: Link Tracker Window
Each time slot in the vertical axis represents the minimum time that a DWORD requires to
traverse the bus.
Toolbar: Presents buttons for changing the format of the Link Tracker window.
Main Display Area: Displays traffic chronologically as it occurred in the recording. The
window divides into columns: the first column shows time and traffic is shown on a
channel‐by‐channel basis in the columns on the right.
10.5.1
Using the Link Tracker Window
The Link Tracker window can be reformatted in several ways.
Synchronize Graph Areas. If two or more graphs are displayed, this
button synchronizes the graphs to one another. Once synchronized,
the positioning slider of one graph moves the other graphs.
Graph Areas. Provides options for creating and displaying additional
graphs of data lengths, packet lengths, and percentage of bus used.