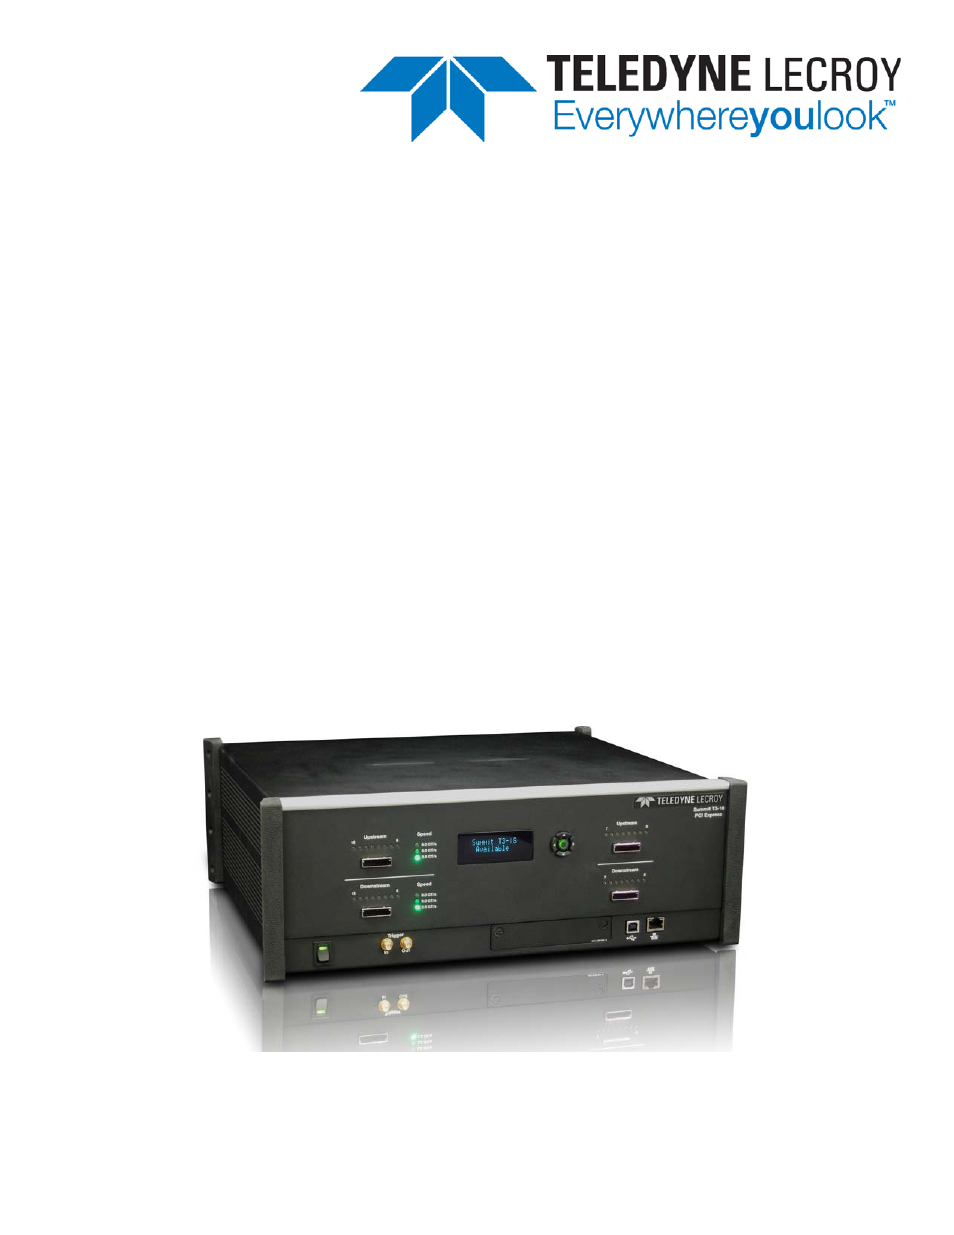
Teledyne LeCroy Summit T3-16 PCIe Multi-lane Protocol Analyzer User Manual User Manual
Teledyne LeCroy Equipment
Table of contents
Document Outline
- Contents
- Overview
- Hardware Description
- Installation and Setup
- 3.1 Installing the PETracer Software
- 3.2 Setting Up the Summit T3-16 Analyzer using a USB Connection
- 3.3 Setting Up the Summit T3-16 Analyzer using an Ethernet Connection
- 3.4 Adding Devices Manually
- 3.5 Analyzer Network
- 3.6 Cascading with CATC SYNC Expansion Card
- 3.7 Interposers and Probes
- 3.8 Using Interposers
- 3.8.1 Summit T3-16 Components
- 3.8.2 Installing the Gen2 Passive Interposer
- 3.8.3 Connecting the Probe Data Cable
- 3.8.4 Power On Analyzer and then DUT
- 3.8.5 Summit T3-16 Components
- 3.8.6 Installing the Gen2 Active Interposer
- 3.8.7 Connecting the Probe Data Cable
- 3.8.8 Power On Analyzer and then DUT
- 3.8.9 Summit T3-16 Components
- 3.8.10 Installing the Gen3 Interposer
- 3.8.11 Connecting the Probe Data Cable
- 3.9 Using Probes
- 3.9.1 Example: Connecting the Summit T3-16 Analyzer to the Device Under Test Using a Gen2 MidBus Probe
- 3.9.2 Example: Connecting the Summit T3-16 Analyzer to the Device Under Test Using a Gen2 Multi-lead Probe for x1 and x4
- 3.9.3 Example: Connecting the Summit T3-16 Analyzer to the Device Under Test Using a Gen2 Multi-lead Probe for x8 and x16
- Software Overview
- 4.1 The PETracer Software
- 4.2 Application Layout
- 4.3 Using the Toolbar
- 4.4 Multi-Segment Toolbar
- 4.5 Using the Menus
- 4.6 Dashboard View
- 4.7 Tool Tips
- 4.8 Keyboard Shortcuts
- 4.9 Status Bar
- 4.10 Making a PCI Express Recording
- 4.11 Recording Multi-Segmented CATC Traces
- 4.12 PETracer Files
- 4.13 Saving CATC Trace Files
- 4.14 Exporting a CATC Trace File
- 4.15 Printing Data Files
- 4.16 Analyzer Chat Window
- Recording Options
- 5.1 Recording Overview
- 5.2 General Tab
- 5.3 Recording Options-General Tab
- 5.4 Simple and Advanced Mode
- 5.5 Trace Filename and Path
- 5.6 Saving and Loading Previously Saved Recording Options
- 5.7 Recording Type
- 5.8 Buffer Size
- 5.9 Upload Size
- 5.10 Misc
- 5.11 Recording Mode
- 5.12 Trigger Position
- 5.13 Save As MultiSegment Trace
- 5.14 Link Settings
- 5.15 Triggering
- 5.16 Recording Rules Overview
- 5.17 Resources
- 5.18 Global State and Sequence States
- 5.19 Navigating Recording Rules
- 5.20 Recording Rules Events
- 5.21 Properties Dialog Boxes for Events
- 5.21.1 Accessing the Properties Dialog
- 5.21.2 Event Properties Dialog Box Features
- 5.21.3 Link State Dialog
- 5.21.4 Ordered Set Properties Dialog
- 5.21.5 Error Properties Dialog
- 5.21.6 DLLP Packet Properties Dialog
- 5.21.7 TLP Header Properties Dialog
- 5.21.8 TLP Prefix Properties Dialog
- 5.21.9 AHCI Register Properties Dialog
- 5.21.10 ATA Command Properties Dialog
- 5.21.11 NVME Register Properties Dialog
- 5.21.12 NVME Command Submission Properties Dialog
- 5.21.13 NVME Command Completion Properties Dialog
- 5.21.14 Actions Properties Dialog
- 5.22 Counter
- 5.23 Timer
- 5.24 Channel
- 5.25 Filter Out
- 5.26 Probe Settings
- Reading CATC Traces
- 6.1 Viewing PCI Express CATC Traces
- 6.2 Expand and Collapse Data Fields
- 6.3 Resizing Cells
- 6.4 Pop-up Menus
- 6.5 View Data Block
- 6.6 Show Raw 10b Codes
- 6.7 Show Header Fields
- 6.8 Packet Cell Popup Menus
- 6.9 Set Marker
- 6.10 Edit or Clear Marker
- 6.11 Compressed CATC Trace View
- 6.12 Spreadsheet View
- 6.13 Decoding Traffic
- Searching CATC Traces
- 7.1 CATC Trace Search Overview
- 7.2 Go to Trigger
- 7.3 Go to Segment/Packet
- 7.4 Go to Packet
- 7.5 Go to Time
- 7.6 Go To Marker
- 7.7 CATC Walk Playlist
- 7.8 Go To Menu
- 7.9 Search Direction
- 7.10 Find
- 7.11 Search for the Next Packet Type
- Display Options
- BitTracer Recording
- 9.1 Enabling BitTracer Recording
- 9.2 Trigger Modes
- 9.3 Views Available for Captured Data
- 9.4 De-skewing Data
- 9.5 Data Display Formats
- 9.6 Color-Coding of BitTracer Contents
- 9.7 Report and Analysis Windows
- 9.8 Timing Measurements Bar
- 9.9 Errors Bar
- 9.10 Symbols Bar
- 9.11 Events Bar
- 9.12 Packets Bar
- 9.13 Decoding Bar
- 9.14 Search
- 9.15 Link Configuration
- 9.16 Export of BitTracer Capture to CATC Trace Format
- 9.17 Compressing and Expanding the Data View
- 9.18 Opening and Saving BitTracer Captures
- Reports and Tools
- 10.1 File Information
- 10.2 Error Summary
- 10.3 Traffic Summary
- 10.4 Bus Utilization
- 10.5 Link Tracker
- 10.6 Data Flow Window
- 10.7 Flow Control Tracking
- 10.8 Using the CATC Trace Navigator
- 10.8.1 Displaying the Navigator
- 10.8.2 Navigator Toolbar
- 10.8.3 Navigator Ranges
- 10.8.4 To Determine Current Position
- 10.8.5 T o Reset Navigator Range
- 10.8.6 Navigator Panes
- 10.8.7 To Show/Hide Navigator Panes
- 10.8.8 Navigator Slider
- 10.8.9 CATC Trace Navigator Legend
- 10.8.10 Using the Legend to Show/Hide Navigator Panes
- 10.8.11 Using the Legend to Set the Priority of Information Display
- 10.9 Detail View
- 10.10 LTSSM Flow Graph
- 10.11 Packet Header Bar
- 10.12 Packet Data Window
- 10.13 Configuration Space View
- 10.14 Using Unit Metrics
- 10.15 Metrics Defined for Link Transactions
- 10.16 Show Metrics in the CATC Trace Display
- 10.17 Show Metrics in the Traffic Summary Window
- 10.18 Show Metrics in the Bus Utilization Window
- 10.19 Real-Time Statistics Window
- 10.20 Memory I/O Space Editor
- 10.21 TC to VC Mapping
- 10.22 Timing and Bus Usage Calculations
- 10.23 PCIe SSD Base Address Mapping
- 10.24 Running Verification Scripts
- Updates and Licensing
- Configuration Space Decoding
- Example of XML File Format for SSD Decodes
- China Restrictions of Hazardous Substances Table
- How to Contact Teledyne LeCroy
- Index

