Teledyne LeCroy LabMaster 10Zi Getting Started Manual User Manual
Page 151
LabMaster 10 Zi Oscilloscopes
144
LM10Zi-GSM-E Rev A
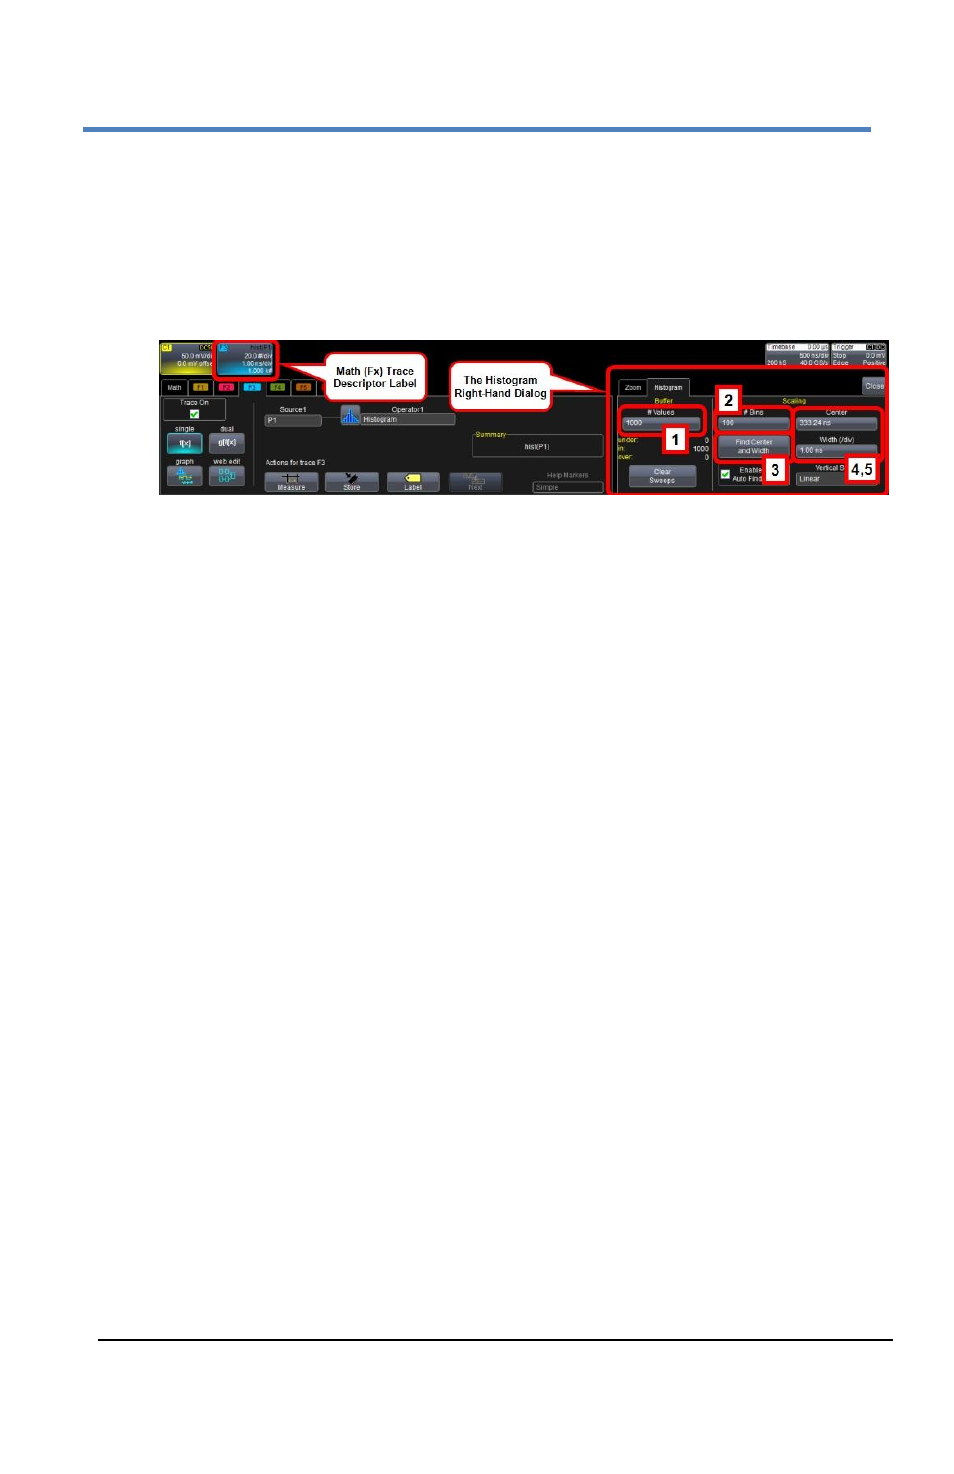
4.
Choose the math trace (F1-F12) in which to display the
histogram.
5.
Touch the new Fx descriptor box to display the Function dialog,
then touch the Histogram tab at the right to display the
Histogram right-hand dialog.
6.
Touch #Values and enter the number of parameter values that
will be contained in the histogram.
7.
Touch #Bins and enter the number of bins that comprise the
histogram. This determines how many bars appear in the
histogram.
8.
To let the oscilloscope position the histogram, check Enable Auto
Find, then touch the Find Center and Width button.
OR
TouchCenter and Width and enter values.
C
REATING A
M
ATH
H
ISTOGRAM
1.
Choose Math → Math Setup... from the menu bar to access the
Math dialog.
2.
If the function for which you want a histogram exists, turn it On
and touch the Fx tab to open the Function dialog.
If the function does not yet exist, first follow steps in Math Setup
(on page 138), then open the Function dialog.
3.
Touch the Graph button on the Function dialog. The histogram of
the function now replaces the original function trace on the Fx grid.