Viewing histograms – Teledyne LeCroy LabMaster 10Zi Getting Started Manual User Manual
Page 150
Getting Started Manual
LM10Zi-GSM-E Rev A
143
Viewing Histograms
Histograms are graphical representations of data which divide it into
intervals or bins. These intervals/bins are plotted on a bar chart such
that the bar height relates to the number of data points inside each
interval/bin.
You can set up histograms to visualize the results of measurement
parameters or math functions on the corresponding Measure or Math
dialogs. You can also create a histogram of a persistence display.
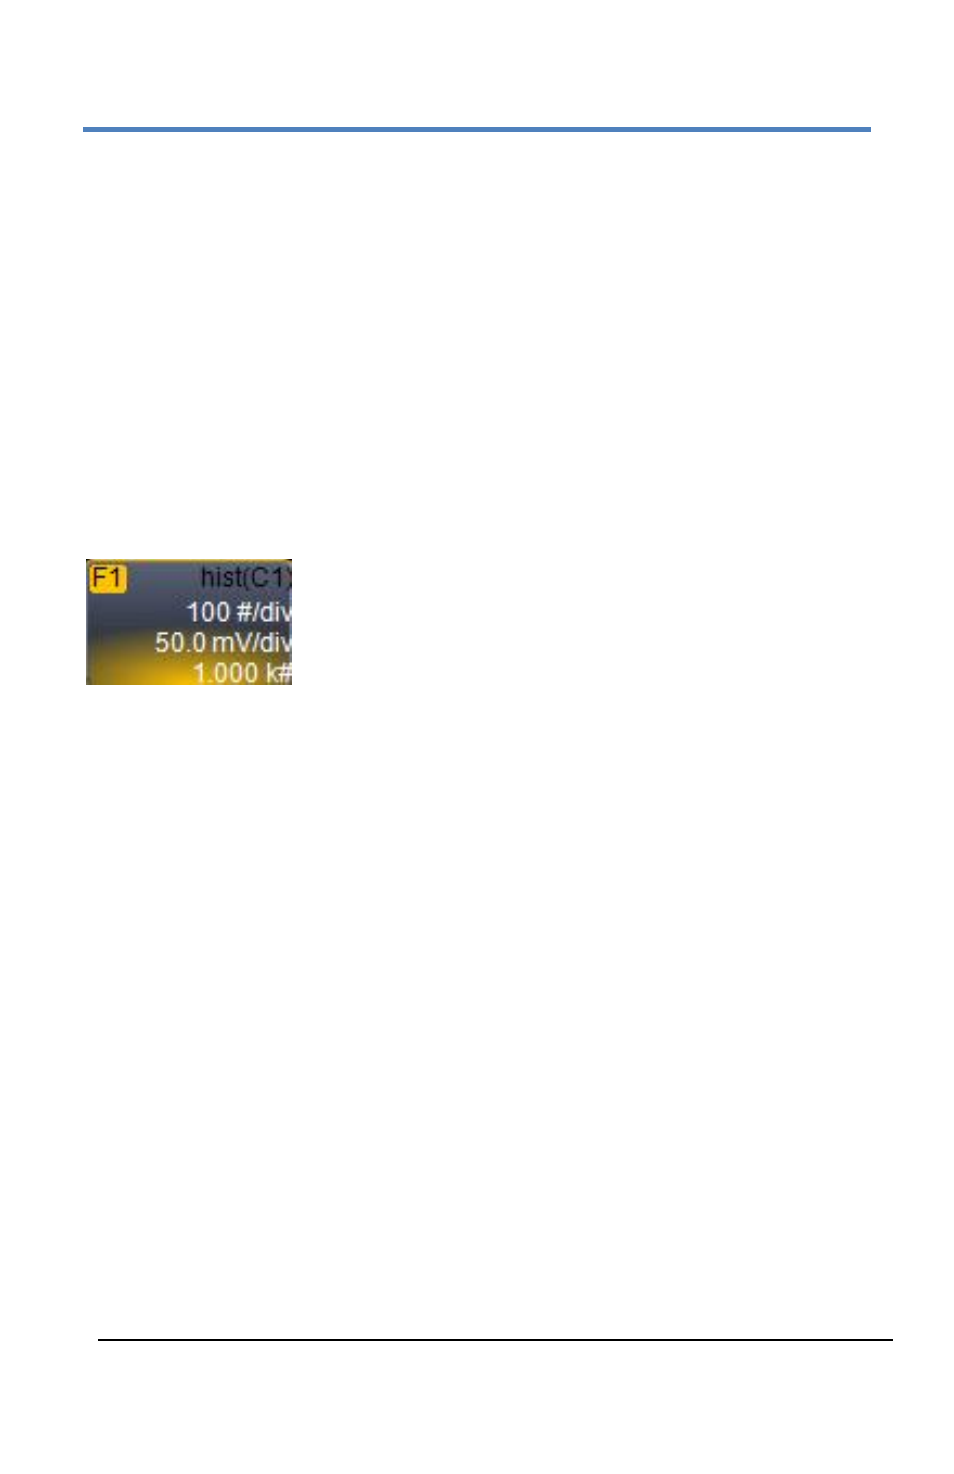
Regardless of which type, the histogram is created as a math (Fx) trace.
The number of sweeps comprising the histogram is shown on the trace
descriptor box:
The range of a histogram is limited to the portion of the source trace
that is visible on screen. If you zoom in on a trace, the histogram does
not contain data for the no longer visible parts of the original trace.
Thumbnail versions of measurement parameter histograms are called
Histicons. They are available as a checkbox option on the Measure
dialog. Histicons appear on the measurement parameter table, rather
than as a new trace.
C
REATING A
M
EASUREMENT
H
ISTOGRAM
1.
Choose Measure → Measure Setup... from the menu bar to
access the Measure dialog.
2.
If the parameter of which you want a histogram exists, turn it On
and touch the Px tab to open the Parameter dialog.
If the parameter does not yet exist, first follow steps in
Parameter Setup (on page 132).
3.
Touch the Histogram button at the bottom of the Parameter
dialog.