ZyXEL Communications ZyXEL ZyAIR 100 User Manual
Page 303
ZyWALL 10~100 Series Internet Security Gateway
Maintenance
20-3
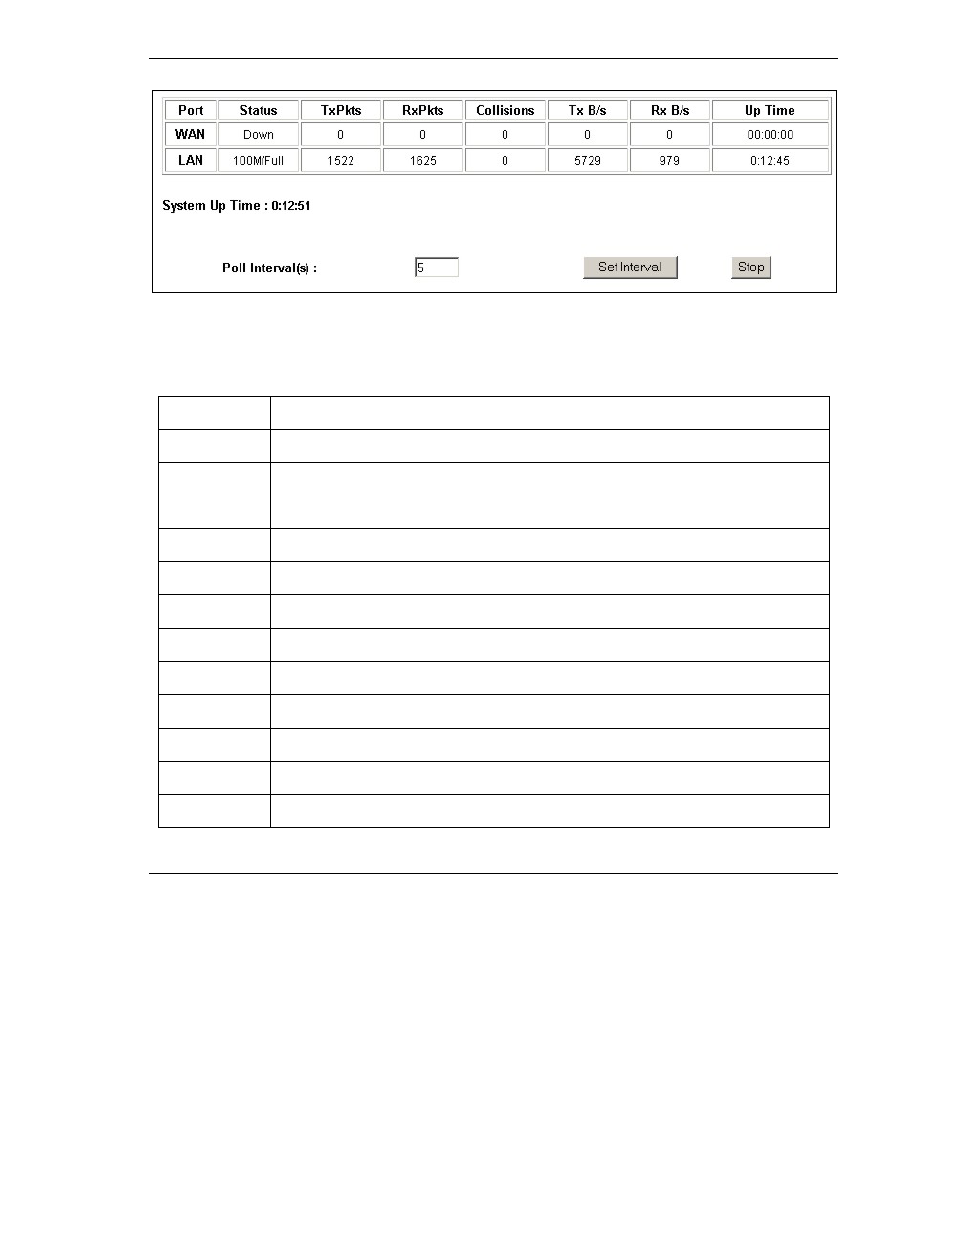
Figure 20-2 System Status: Show Statistics
The following table describes the fields in this screen.
Table 20-2 System Status: Show Statistics
LABEL
DESCRIPTION
Port
This is the WAN, LAN, DMZ or Wireless LAN port.
Status
This displays the port speed and duplex setting if you're using Ethernet encapsulation
and down (line is down), idle (line (ppp) idle), dial (starting to trigger a call) and drop
(dropping a call) if you're using PPPoE encapsulation.
TxPkts
This is the number of transmitted packets on this port.
RxPkts
This is the number of received packets on this port.
Collisions
This is the number of collisions on this port.
Tx B/s
This displays the transmission speed in bytes per second on this port.
Rx B/s
This displays the reception speed in bytes per second on this port.
Up Time
This is the total amount of time the line has been up.
System Up Time
This is the total time the ZyWALL has been on.
Poll Interval(s)
Enter the time interval for refreshing statistics in this field.
Set Interval
Click this button to apply the new poll interval you entered in the Poll Interval(s) field.