Specific connection menu options – Freescale Semiconductor Microcontrollers User Manual
Page 504
HCS08 On-Chip DBG Module
Specific Connection Menu Options
504
Microcontrollers Debugger Manual
• Real time program code profiling and coverage within the Profiler and Coverage
window components (open the Profiler and/or the Coverage components to display
code profiling and code coverage).
Specific Connection Menu Options
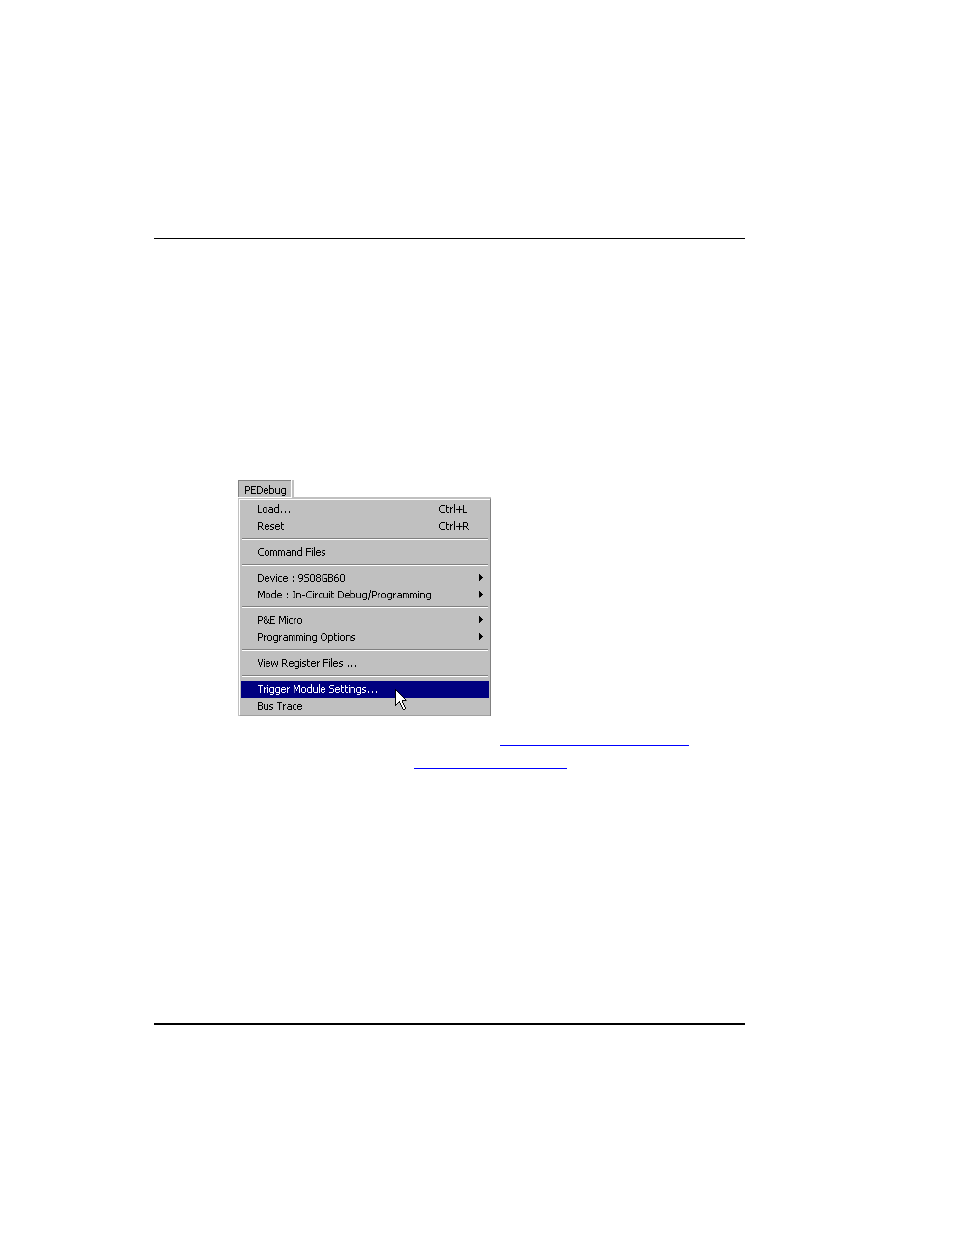
Specific DBG support menu options are added to the Connection menu as soon as the
debugger target processor is acknowledged by the DBG module. Two additional context
menu entries are displayed: Trigger Module Settings and Bus Trace. Shown below is an
example with the P&E (PEDebug) connection.
Figure 23.1 Connection Menu - Added DBG Options
Choose Trigger Module Settings to open the
Trigger Module Settings Window
.
Choose Bus Trace to open the