Trace component, Trace operations, Trace menu – Freescale Semiconductor Microcontrollers User Manual
Page 130
Debugger Components
General Debugger Components
130
Microcontrollers Debugger Manual
Trace Component
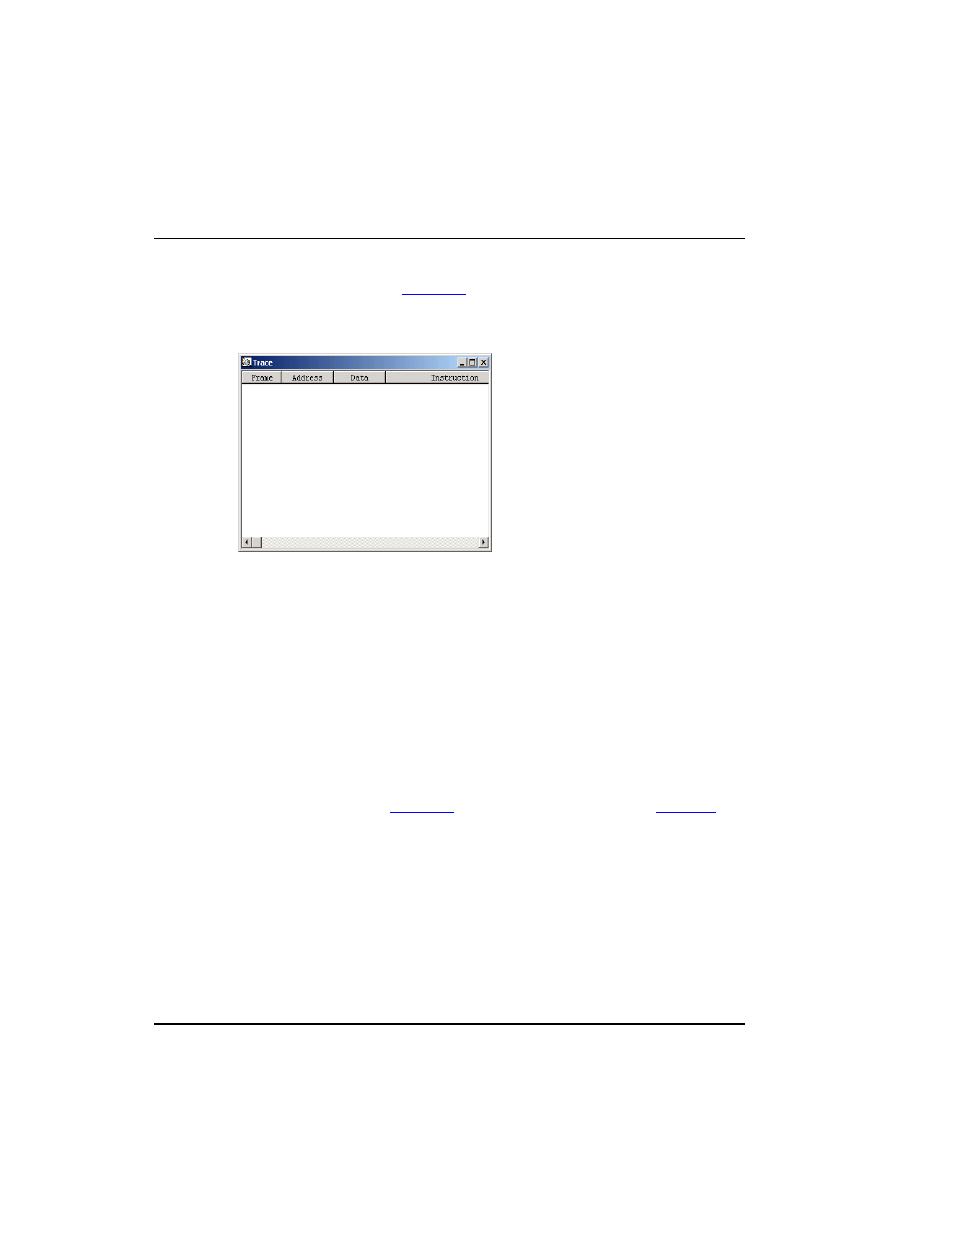
The Trace window shown in
Figure 3.73
records and displays instruction frames and time
or cycles.
Figure 3.73 Trace Window
Trace Operations
Pointing at a frame and dragging the mouse forces all open windows to show the
corresponding code or location. Time and cycles of all other frames are evaluated relative
to this base.
Holding down the left mouse button and pressing the Z key sets the zero base frame to the
pointed frame.
Holding down the left mouse button and pressing the D key forces all open component
windows to show the code matching the pointed to frame.
Trace Menu
The Trace Menu shown in
Figure 3.74
contains the functions described in
Table 3.38
.
Trace menu entries vary depending on the connection.