Debugger main window toolbar, Debugger main window status bar, Main window menu bar – Freescale Semiconductor Microcontrollers User Manual
Page 33
Debugger Interface
Debugger Main Window
33
Microcontrollers Debugger Manual
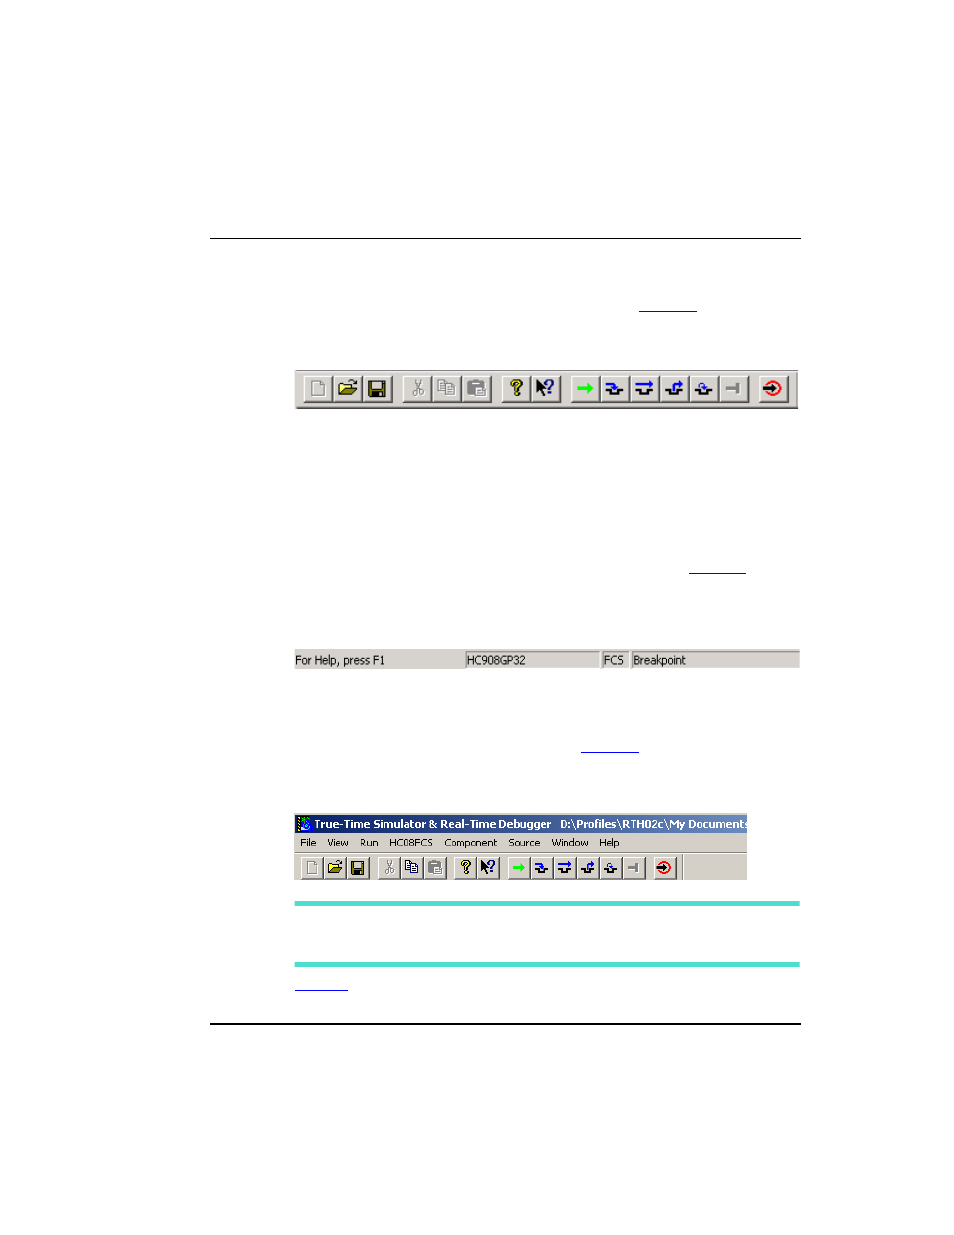
Debugger Main Window Toolbar
The Debugger Main Window toolbar is the default toolbar. Most of the Main Window
menu commands have a related shortcut icon on this toolbar.
identifies each
default icon.
Figure 2.4 Debugger Main Window Toolbar
A tool tip is available when you point the mouse at an icon.
Debugger Main Window Status Bar
The status bar at the bottom of the Debugger Main Window, shown in
contains
a context sensitive help line for connection specific information, e.g., number of CPU
cycles for the Simulator connection and execution status.
Figure 2.5 The Debugger Status Bar
Main Window Menu Bar
The Debugger Main Window Menu Bar, shown in
is associated with the main
function of the debugger application, connection, and selected windows.
Figure 2.6 Debugger Window Menu Bar
NOTE
You can select menu commands by pressing the ALT key to select the menu
bar then press the key corresponding to the underlined letter in the menu
command.
describes menu entries available in the menu bar.
Ne
w
Open
Sa
ve
Cu
t
Cop
y
P
as
te
He
lp
H
el
p
on
to
pi
c
R
un
S
ingl
e
st
ep
S
tep o
ver
S
tep out
A
ss
em
bl
y
st
ep
H
al
t
R
ese
t ta
rg
et