Profiler operations, Profiler menu – Freescale Semiconductor Microcontrollers User Manual
Page 107
Debugger Components
General Debugger Components
107
Microcontrollers Debugger Manual
Profiler Operations
Click the fold/unfold icon to unfold/fold the source module.
Profiler Menu
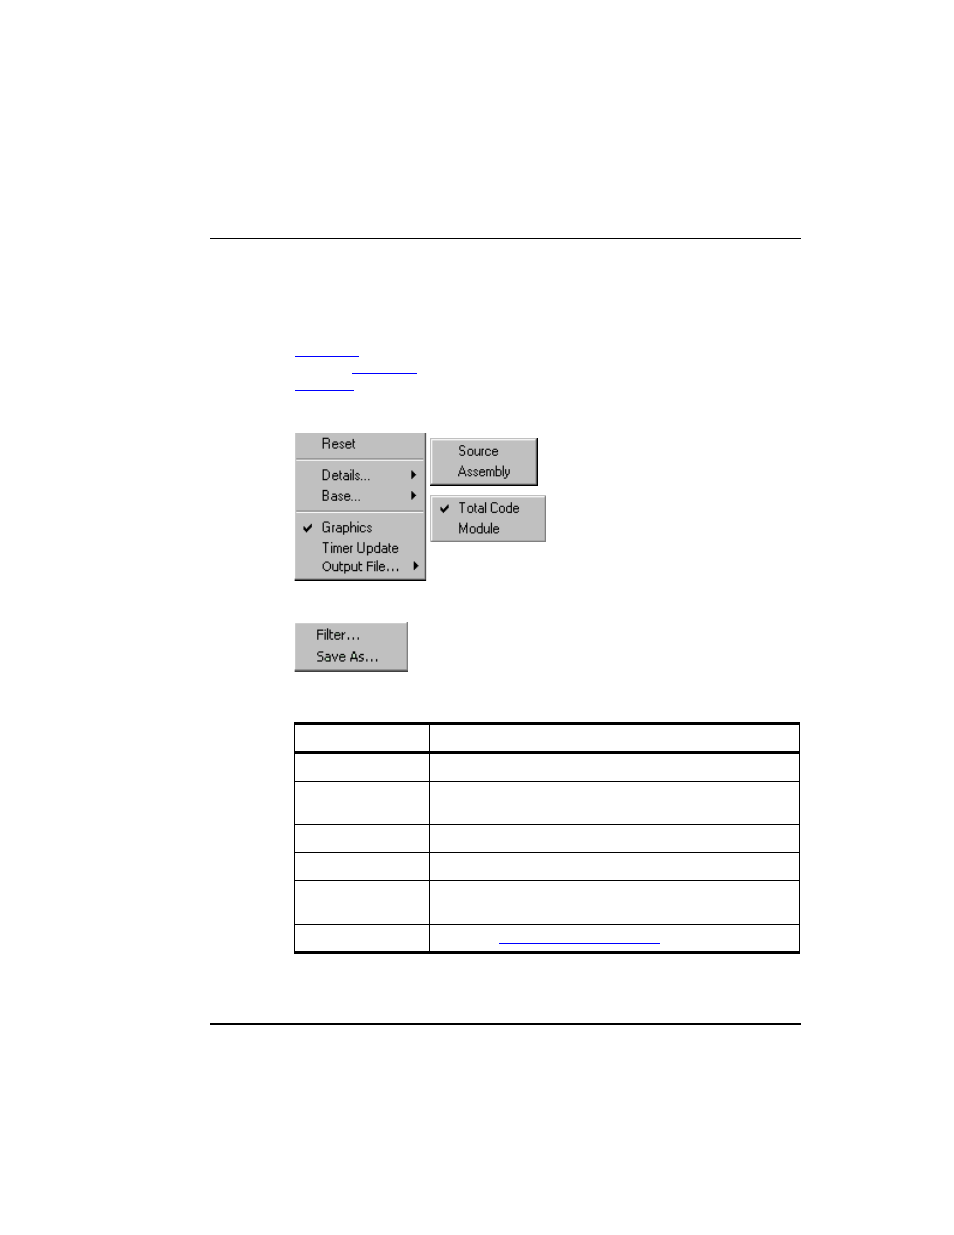
shows the Profiler Menu entries, with the Details submenu and the Base
shows the Profiler Output File submenu. Entries are described in
.
Figure 3.50 Profiler Menu and Submenus
Figure 3.51 Profiler Output File Submenu
:
Table 3.27 Profiler Menu Entries Description
Menu Entry
Description
Reset
Resets all statistics.
Details
Sets a split view in the chosen component (Source or
Assembly)
Base
Sets the base of percentage (total code or module code).
Graphics
Toggles the display from graphics bar.
Timer Update
Switches on/off the periodic update of the Coverage
component. If activated, statistics are updated each second.
Output File
Set up the
Profiler Output File Functions
.