Starting the debugger, Starting from within the ide, Starting debug from the project window – Freescale Semiconductor Microcontrollers User Manual
Page 28
Debugger Interface
Starting the Debugger
28
Microcontrollers Debugger Manual
The following list is an overview of files that the CodeWarrior IDE uses for C/C++
debugging:
• hiwave.exe
Debugger executable file
• hibase.dll
Debugger main function dll
• elfload.dll
Debugger loader dll
• *.wnd
Debugger component
• *.tgt
Debugger target file
• *.cpu
Debugger CPU awareness file
Starting the Debugger
This section explains how you can start the debugger from within the CodeWarrior IDE or
from a DOS command line.
Starting from within the IDE
There are two ways to start the debugger from within the IDE, from a Project window
icon, or from the IDE Main Window menu bar.
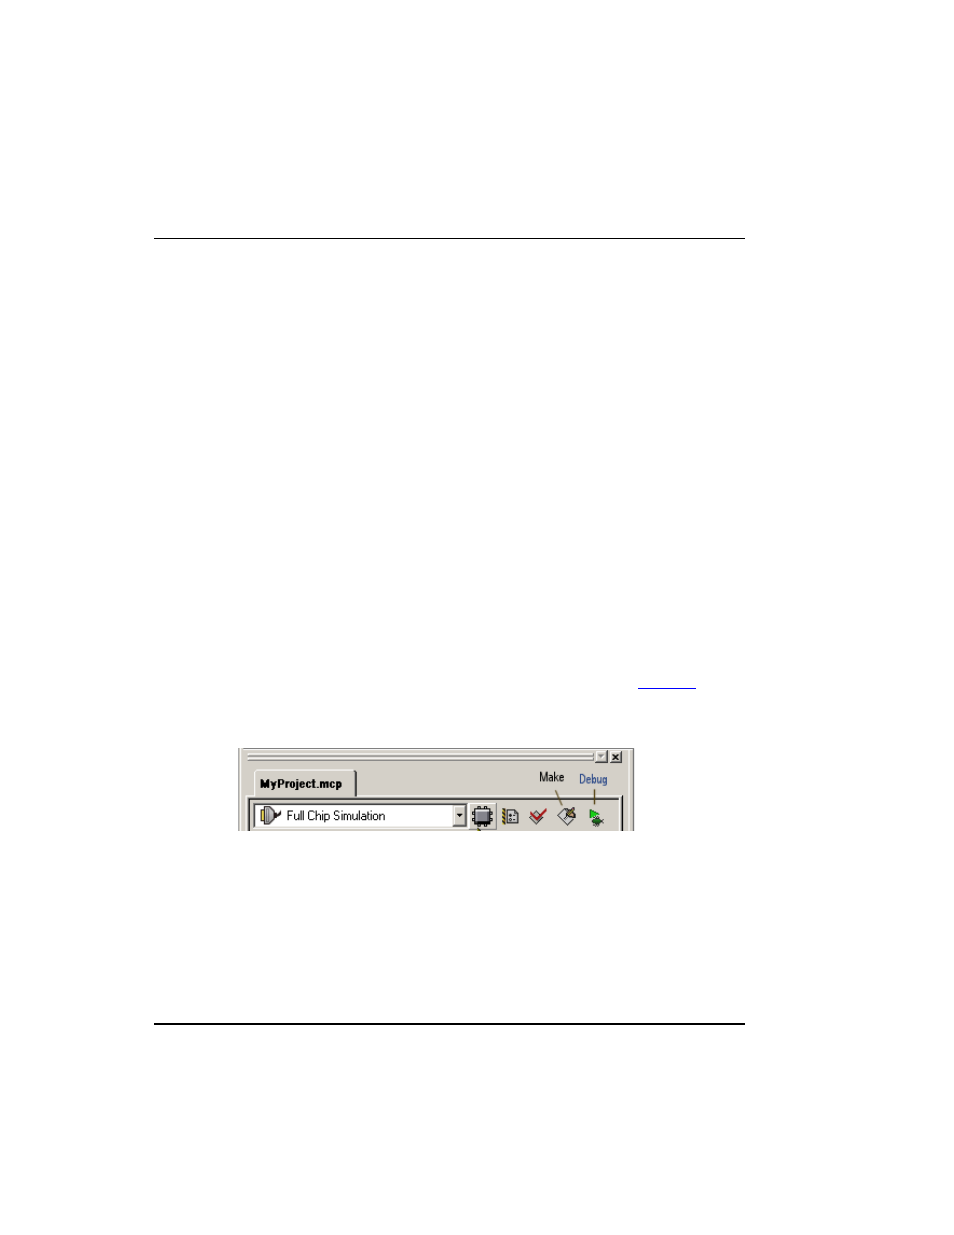
Starting Debug from the Project Window
To start the debugger from the Project window, click the Debug icon (
), at the
top of the Project window.
Figure 2.1 Project Window Make and Debug Icons