Fluorophore selector, Trace styles window – Bio-Rad Firmware & Software Updates User Manual
Page 99
Data Analysis Windows
86
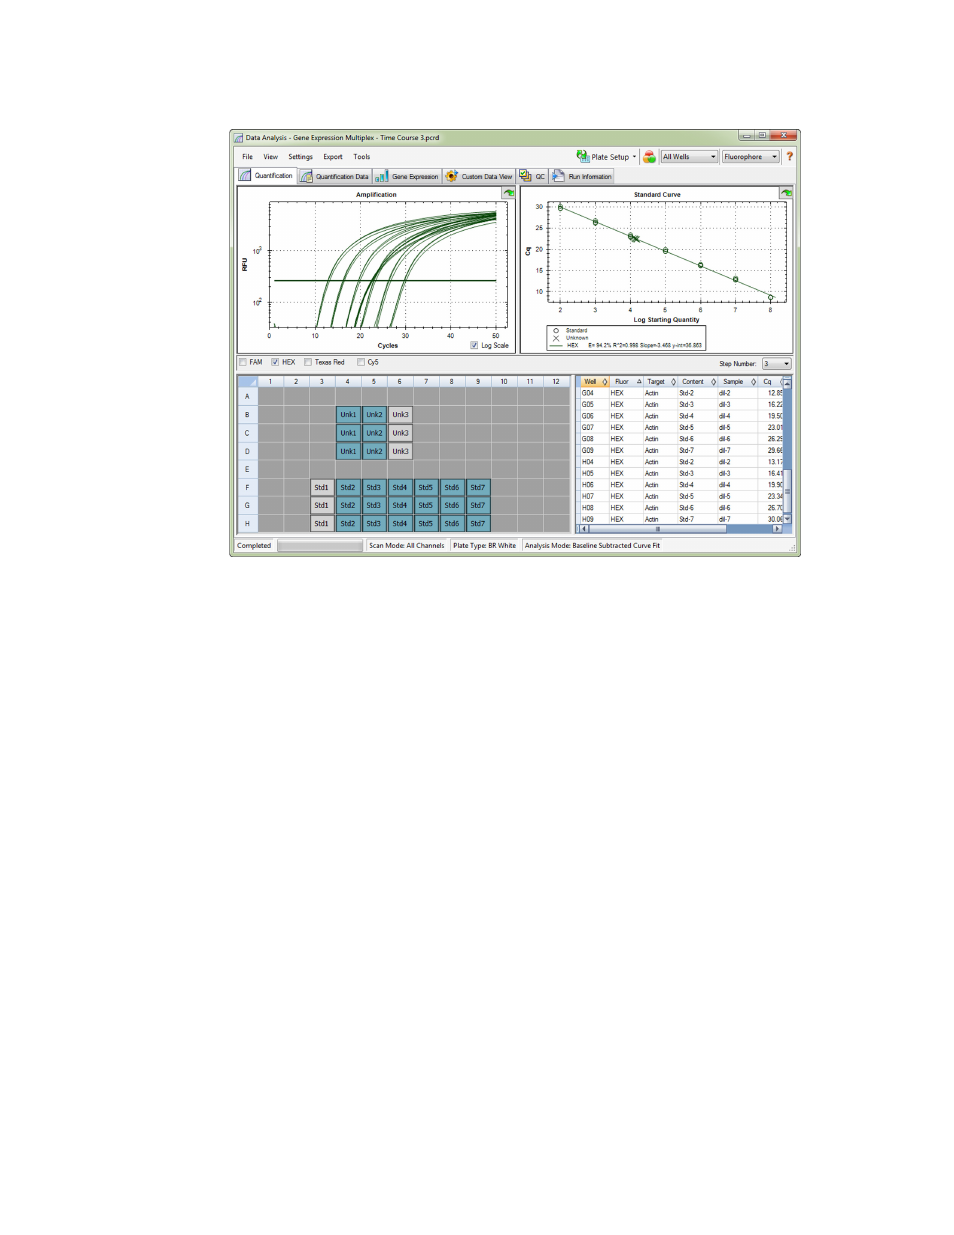
Figure 60. Layout for the Quantification tab in the Data Analysis window.
Fluorophore Selector
To select the fluorophore data to display in the Quantification tab charts and spreadsheets,
click the fluorophore selector below the Amplification chart. Click the box next to the
fluorophore name to show or hide the fluorophore data throughout the data analysis window.
Trace Styles Window
Open the Trace Styles window (Figure 61) to adjust the appearance of traces in the
amplification and melt curve charts in the Quantification and Melt Curve tabs.
To open this window, follow these steps:
1. Select only one fluorophore in the fluorophore selection boxes (Figure 54 on page 78)
under the Amplification chart.
2. Click the Trace Styles button in the Data Analysis toolbar, select Settings > Trace
Styles in the Data Analysis menu bar, or right-click on a trace and select Trace Styles.