Plate spreadsheet – Bio-Rad Firmware & Software Updates User Manual
Page 104
CFX96 Touch, CFX96 Touch Deep Well, CFX Connect, and CFX384 Touch Systems Instruction Manual
91
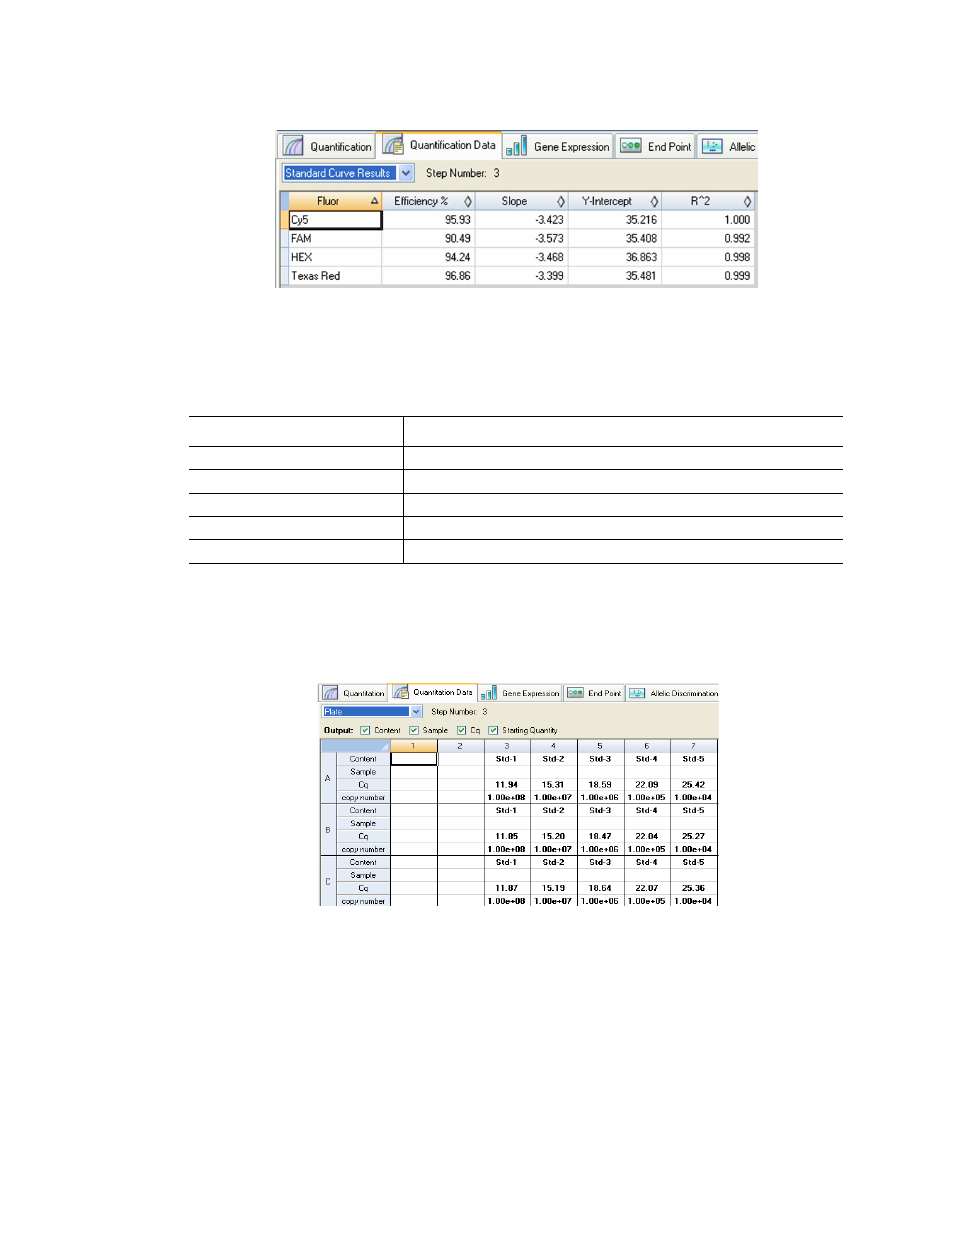
Figure 65. Standard Curve Results spreadsheet in the Quantification Data tab.
These values can be copied and pasted into a document by right-clicking and selecting Copy
or a file can be created by choosing one of the Export options.
Table 27. Standard Curve Results spreadsheet contents.
Plate Spreadsheet
Select the Plate spreadsheet to see a plate map of the data for one fluorophore at a time.
Select each fluorophore by clicking a tab at the bottom of the spreadsheet. Figure 66 shows
the Plate spreadsheet as a plate map.
Figure 66. Plate spreadsheet in the Quantification Data tab.
Information
Description
Fluor (or Target)
Fluorophore (or Target) detected
Efficiency %
Reaction efficiency
Slope
Slope of the standard curve
Y-intercept
Point at which the curve intercepts the y-axis
R^2
Coefficient of determination