Results spreadsheet, Standard curve results spreadsheet – Bio-Rad Firmware & Software Updates User Manual
Page 103
Data Analysis Windows
90
Results Spreadsheet
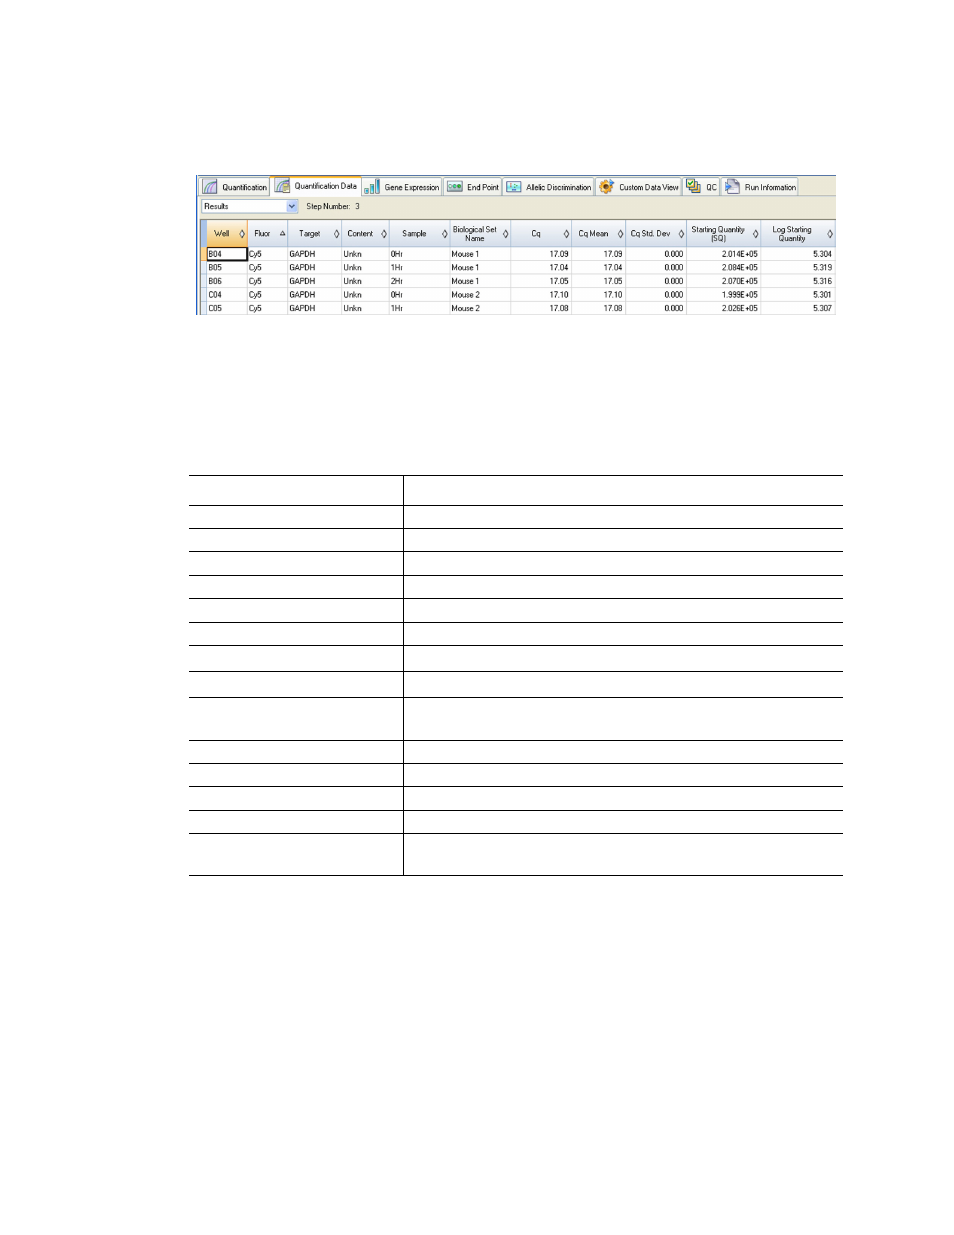
Select a Results spreadsheet (Figure 64) to see data for each well in the plate.
Figure 64. Quantification Data tab with Results spreadsheet selected.
NOTE: All Std. Dev (standard deviation) calculations apply to the replicate groups
assigned in the wells in the Plate Editor window. The calculations average the C
q
value for each well in the replicate group.
The Results spreadsheet includes the types of information listed in Table 26.
Standard Curve Results Spreadsheet
Select the Standard Curve Results spreadsheet (Figure 65) to see the calculated standard
curve parameters.
Table 26. Results spreadsheet content.
Information
Description
Well
Well position in the plate
Fluor
Fluorophore detected
Target
Amplification target name (gene)
Content
Sample type and Replicate #
Sample
Sample description
Biological Set Name
Name of the biological set
C
q
Quantification cycle
C
q
Mean
Mean of the quantification cycle for the replicate group
C
q
Std. Dev
Standard deviation of the quantification cycle for the replicate
group
Starting Quantity (SQ)
Estimate of the starting quantity of the target
Log Starting Quantity
Log of the starting quantity
SQ Mean
Mean of the starting quantity
SQ Std. Dev
Standard deviation of the starting quantity across replicates
Set Point
Temperature of sample in the well for a gradient step across
replicates