End point tab, D(rfu)/dt spreadsheet – Bio-Rad Firmware & Software Updates User Manual
Page 109
Data Analysis Windows
96
Table 30 lists the types of information shown in the RFU spreadsheet.
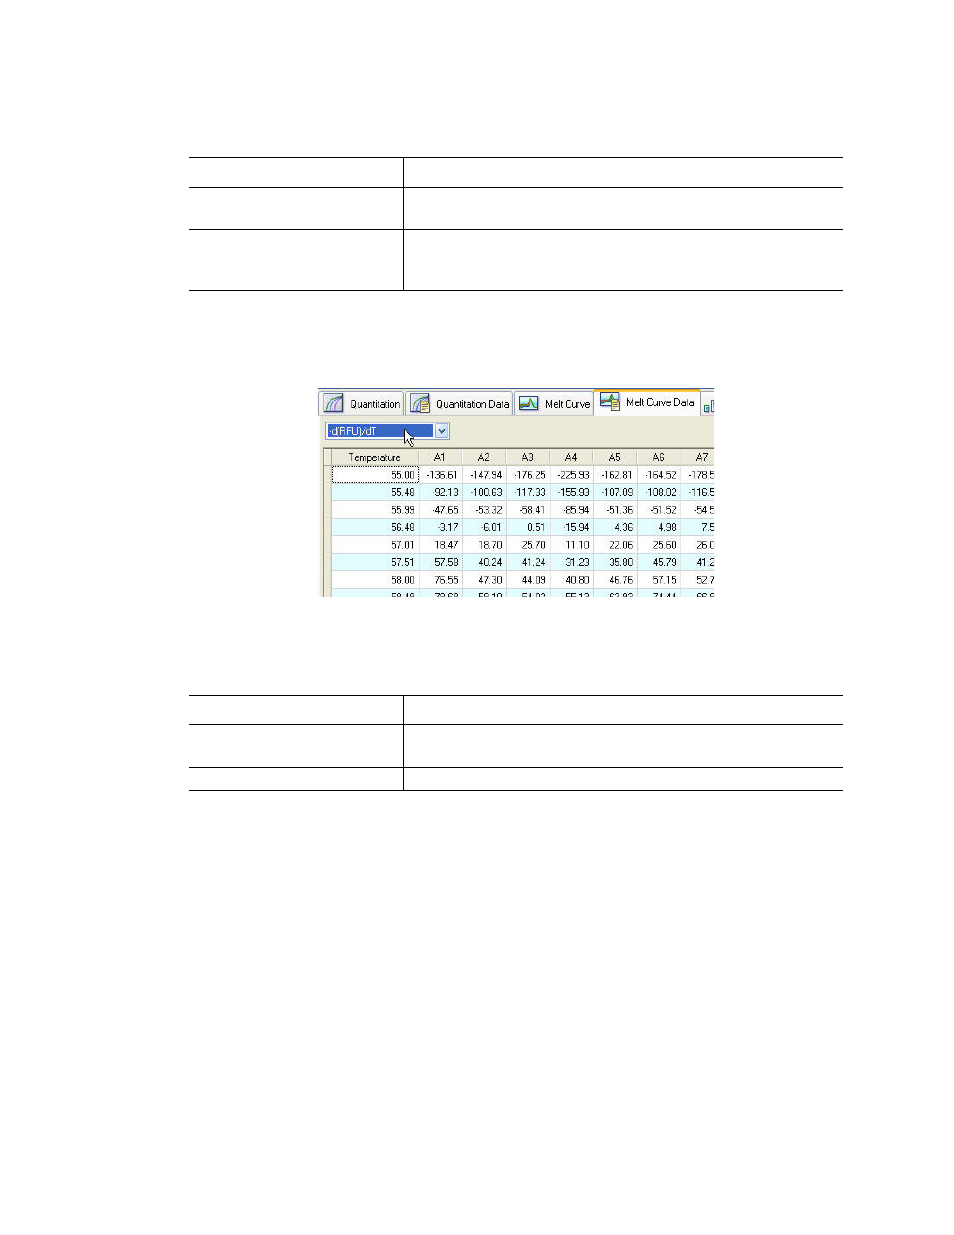
-d(RFU)/dT Spreadsheet
Select the -d(RFU)/dT spreadsheet to view the types of data shown in Figure 72.
Figure 72. The -d(RFU)/dT spreadsheet in the Melt Curve Data tab.
Table 31 lists the types of information shown in the -d(RFU)/dT spreadsheet.
End Point Tab
Open the End Point tab to analyze final relative fluorescence units (RFUs) for the sample wells.
The software compares the RFU levels for wells with unknown samples to the RFU levels for
wells with negative controls and “calls” the unknown as a Positive or Negative. Positive
samples have an RFU value that is greater than the average RFU value of the negative controls
plus the Cut Off Value.
To analyze the end point data, the plate must contain negative controls or the software cannot
make the call. Run one of these two types of protocols:
•
Run a Quantification protocol. Set up a standard protocol. After completion of the run,
open the Data Analysis window, adjust the data analysis settings in the Quantification
tab, and then click the End Point tab to pick an end point cycle
•
Run an End Point Only protocol. Load the End Point Only protocol in the Plate tab of
the Run Setup window, select or create a plate, and start the run
Table 30. RFU spreadsheet content.
Information
Description
Well number (A1, A2, A3, A4,
A5...)
Well position in the plate for the loaded wells
Temperature
Melting temperature of the amplified target. Plotted as one
well per row and multiple wells for multiple products in the
same well
Table 31. -d(RFU)/dT spreadsheet content.
Information
Description
Well number (A1, A2, A3, A4,
A5...)
Well position in the plate for the loaded wells
-d(RFU)/dT
Negative rate of change in RFU as temperature (T) changes