Standard curve chart, Chart menu options – Bio-Rad Firmware & Software Updates User Manual
Page 101
Data Analysis Windows
88
Standard Curve Chart
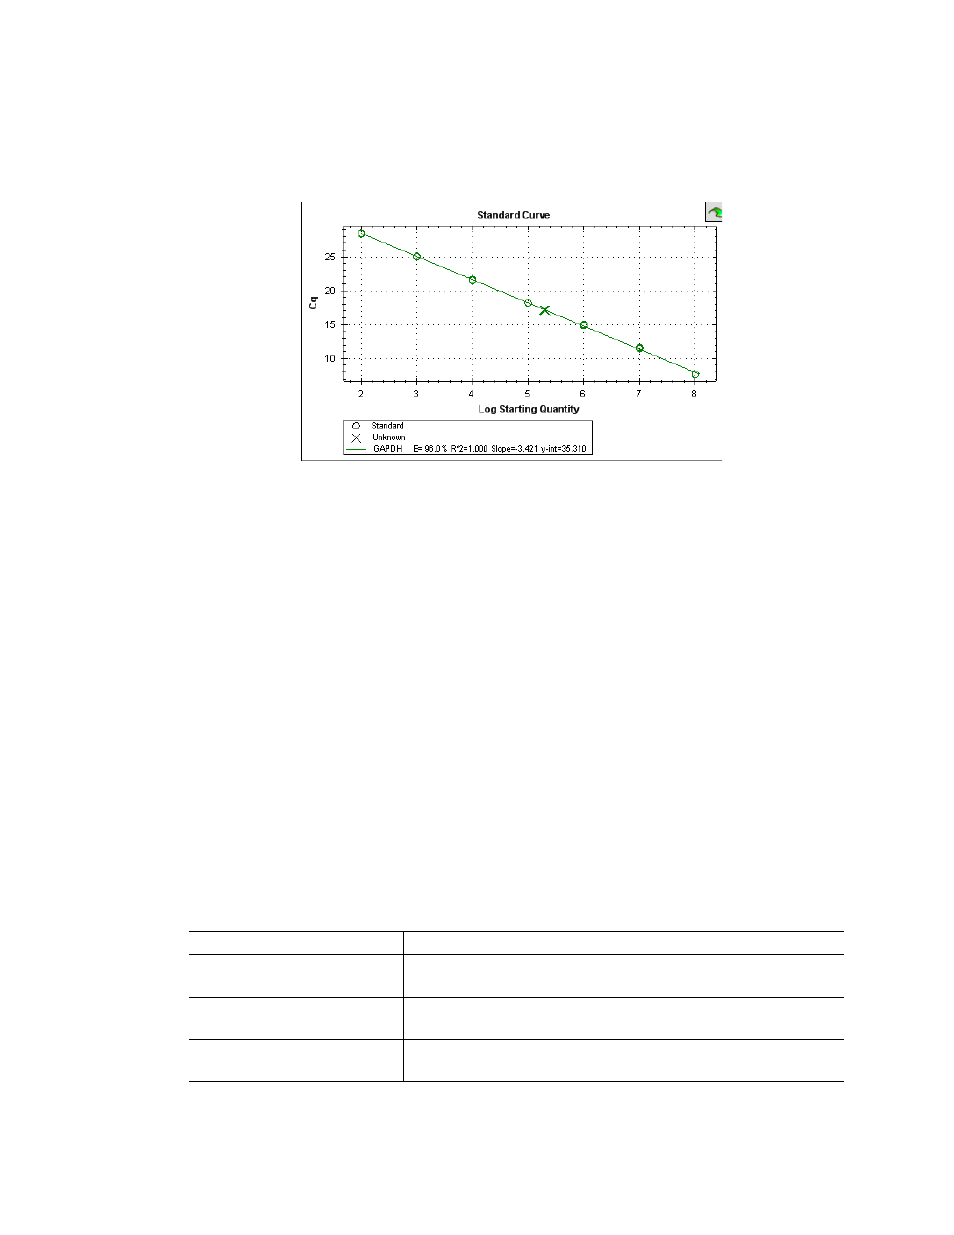
The software creates a Standard Curve chart (Figure 63) in the Quantification tab if the data
include sample types defined as standard (Std) for one fluorophore in the run.
Figure 63. Standard Curve chart.
The Standard Curve chart displays the following information:
•
Name for each curve (the fluorophore or target)
•
Color of each fluorophore or target
•
Reaction efficiency (E). Use this statistic to optimize a multiplex reaction and to
equalize the data for a standard curve
NOTE: The reaction efficiency describes how much of your target is being
produced with each cycle in the protocol. An efficiency of 100% means that you
are doubling your target with each cycle.
•
Coefficient of determination, R
2
(written as R^2). Use this statistic to determine how
correctly the line describes the data (goodness of fit)
•
Slope
•
y-intercept
Chart Menu Options
In addition to the common right-click menu options to copy, print, and export charts, Table 24
lists the menu options available only on the Amplification chart.
Table 24. Amplification chart right-click (and drag) and left-click (and drag) menu
Menu Option
Function
Well XX, Fluor/Target
View only this well, remove this well from view, set color for
this trace, or exclude this well from analysis
Selected Traces
View only these wells, remove these wells from view, set color
for these traces, or exclude these wells from analysis
Show Threshold Values
Display the threshold value for each amplification curve on the
chart