Advanced seed monitoring, Bar graph, Dvanced – Kinze Ag Leader Integra User Manual
Page 214: Onitoring, Raph
198
Firmware Version 5.2
A
DVANCED
S
EED
M
ONITORING
B
AR
G
RAPH
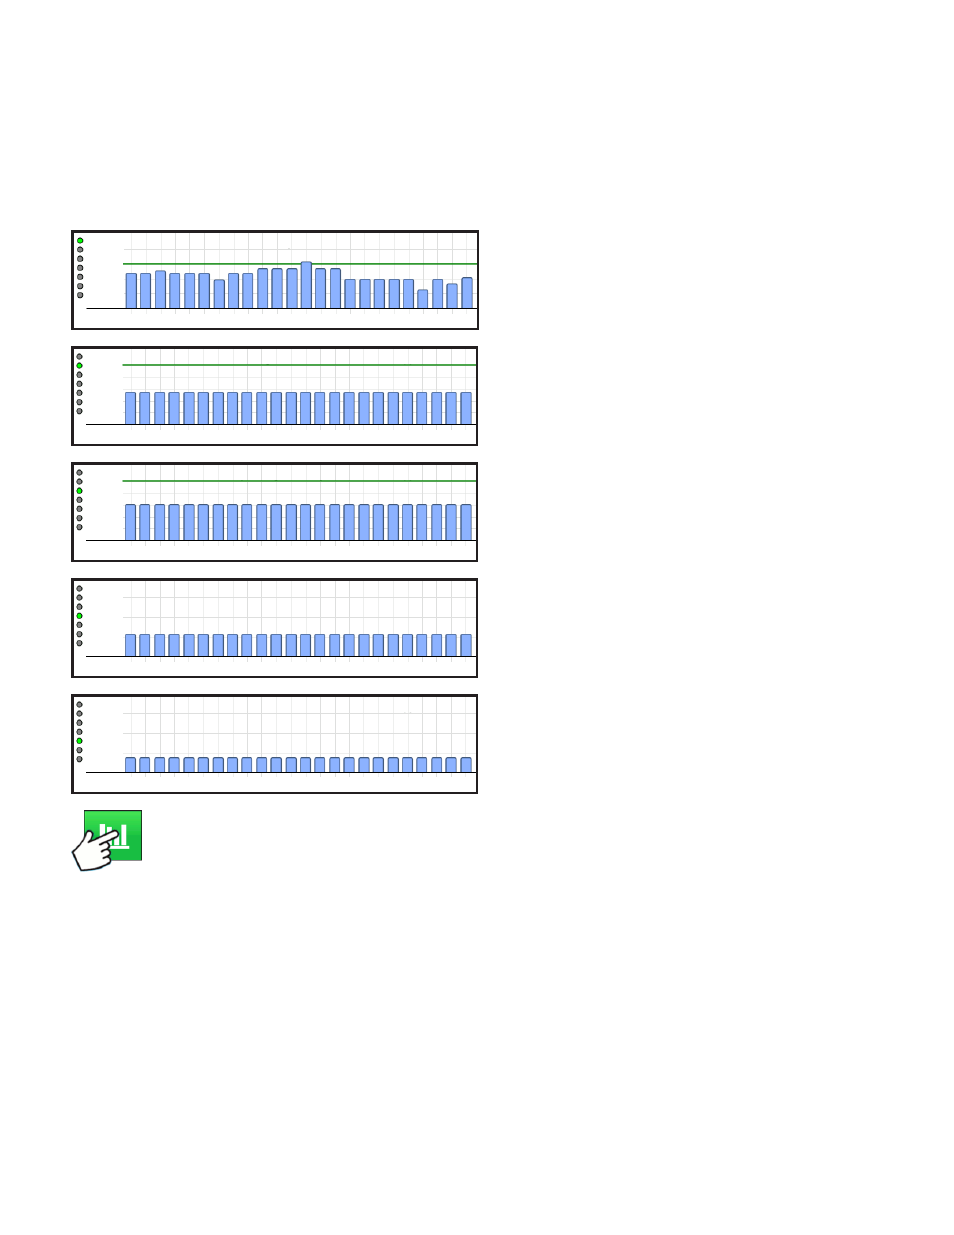
Tapping subsequently will toggle the bar graph between all the following seed placement performance
graphs.
Press: Advanced Seed Monitoring button
2
4
6
8
10
12
14
16
18
20
22
24
120 %
100 %
80 %
60 %
Population 32000 sds/ac
2
4
6
8
10
12
14
16
18
20
22
24
100 %
98 %
96 %
94 %
Singulation 95.5 %
92 %
2
4
6
8
10
12
14
16
18
20
22
24
100 %
98 %
96 %
94 %
92 %
Spacing Quality 96.2 %
2
4
6
8
10
12
14
16
18
20
22
24
6 %
4 %
2 %
Skips 2.3 %
2
4
6
8
10
12
14
16
18
20
22
24
6 %
4 %
2 %
Doubles 1.5 %