Planting map screen - zoom to extent, Lanting, Creen – Kinze Ag Leader Integra User Manual
Page 211: Oom to, Xtent
195
P
LANTING
S
EED
T
UBE
M
ONITOR
M
ODULE
• (F) Seed Tube Monitor bar graph
Bars represent row units. Each bar’s row height represents that row’s population in comparison with the
target rate specified on the Product Control Toolbox.
1. STMM Configuration procedure.
“Create Planting Configuration” on page
.
2. Adjust Sensor Configuration and Alarms. Press the Seed Monitor Setup button on the Configuration
Setup screen. This summons the Seed Monitor Setup window. For more information, see
“Seed Tube Sensor Configuration” on page
and
3. Adjust Seed Monitor Options on the Equipment Tab of the Map screen. See
P
LANTING
M
AP
S
CREEN
- Z
OOM TO
E
XTENT
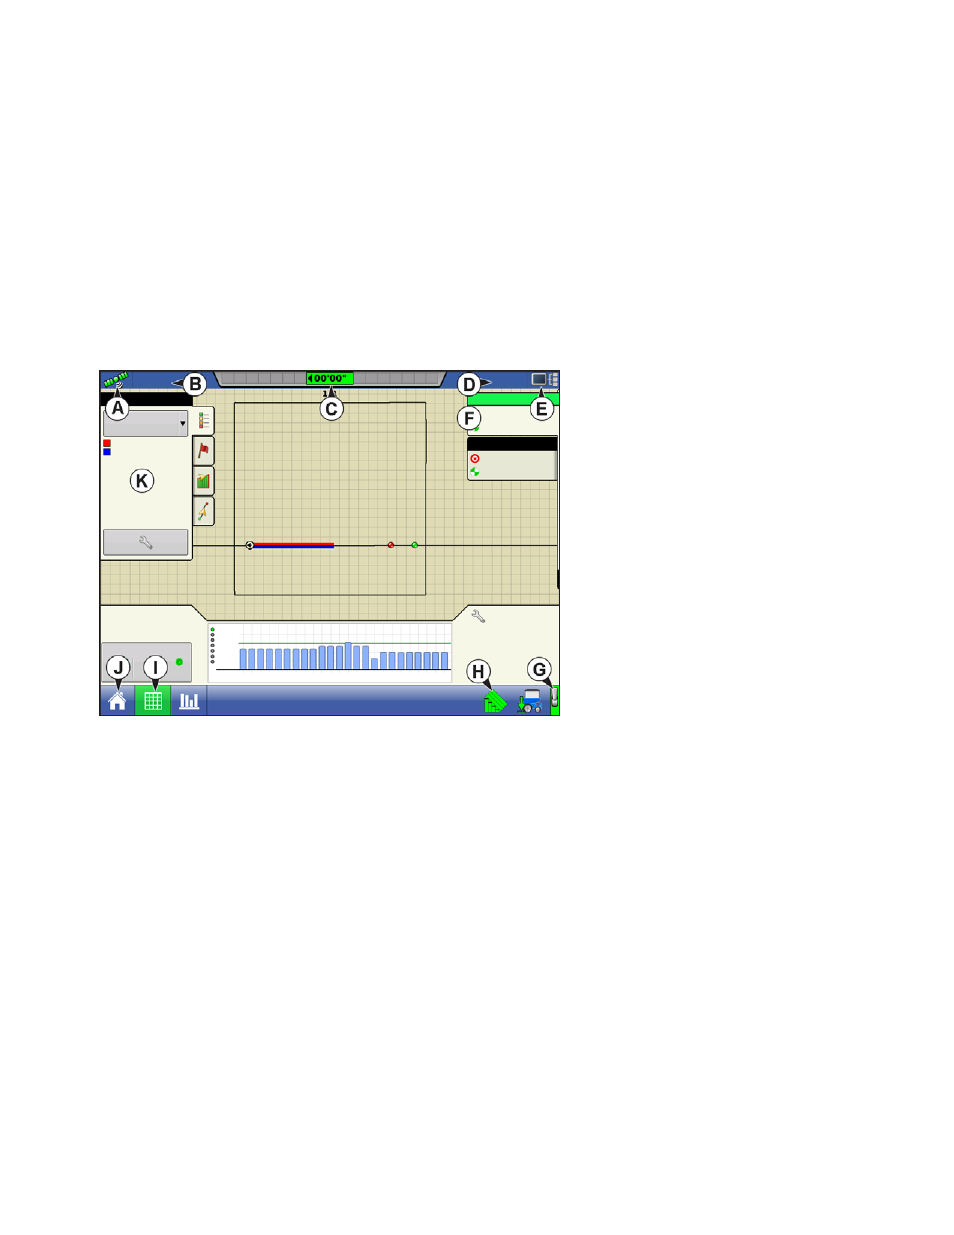
• (A) GPS Status
• (B) Total Field Acres
• (C) On-screen Lightbar
• (D) Ground Speed
• (E) Diagnostics button
• (F) Productivity tab (Variety)
• (G) Master Switch indicator
• (H) AutoSwath
• (I) Map View button
• (J) Home button
• (K) Map Legend (Varieties)
Notes:
• Pressing the Map View button will cycle between the available map screen views, and the appearance of
the Map View button changes.
• At the Zoom to Extent map view, the Map Legend shows varieties.
36000
36000
32000
3200
38.4
ac
5.0
mph
C1291
C1966
Varieties
Corn
C1291
C1291
sds/ac
sds/ac
Population: 32000 sds/ac
Spacing: 6.7 in
Planter Drives (rpm)
Settings
37
Down Force
Gauge Wheel:
197 lb
Down Force:
197 lb
2
4
6
8
10
12
14
16
18
20
22
24
120 %
100 %
80 %
60 %