Mapping icons to point data, Setting icons based on fields, Mapping icons to – Google Earth User Guide User Manual
Page 105: Point data, For details
❍
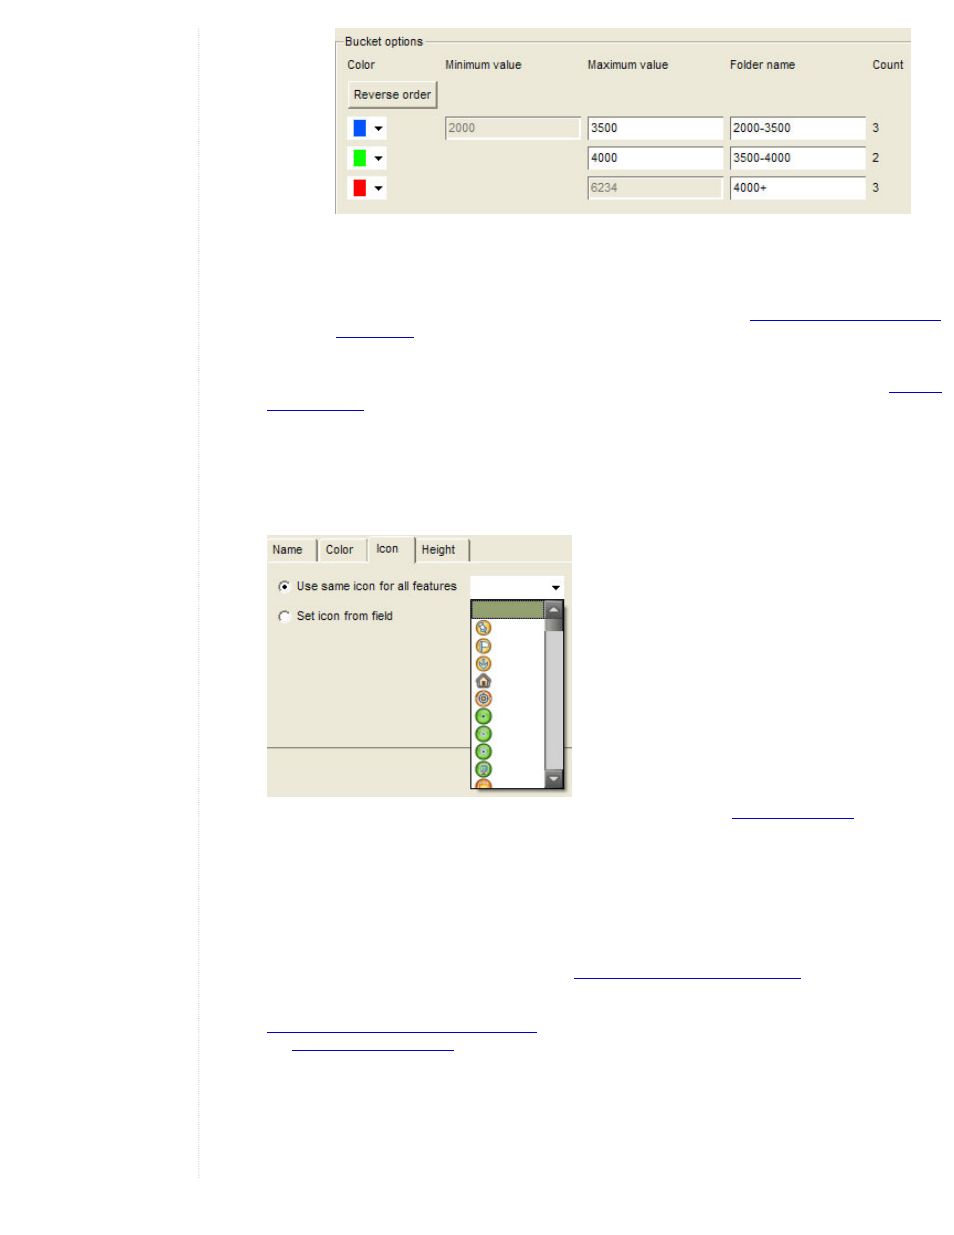
Color display order - You can click the Reverse order button to reverse the display order of the color
range. So, if you have a range of colors starting with blue for the first element and ending with red for the
last one, reversing the order will apply red to the first element and blue to the last.
❍
Color adjustments to single buckets - You can modify each color element individually by clicking on it
and adjusting the color for that particular value or value range. In addition, you can modify the settings for
numeric buckets to adjust the spread of the data to your preference. See
Customizing the Value Range for
to learn how to adjust the numeric ranges once you choose the number of buckets for a
range of numbers.
6. Click the OK button to apply and view your changes. - Save the style template. You can always edit the template
Mapping Icons to Point Data
As with color, you can apply icons to fields in your data. However, icons can only be mapped to point data, so if you are
importing line or shape data, the Icon style tab will be unavailable. You can use two mechanisms for mapping icons to points:
●
Use the same icon for all features - To do this, simply select the Use same icon for all features option and choose
an icon from the drop-down list.
●
Set icon from a field - The actions for doing this are similar to those described in
described in the sections that follow.
Setting Icons Based on Fields
These steps describe the basic process of mapping icons to fields in your data. The following steps describe the basic
process for defining color values by a data field.
1. Select the Set icon from field option in the Icon tab.
2. Choose the field that you want to apply icon labels to from the Set icon from field drop-down list. Here, you can choose
either numeric fields or text fields from your data. See
Choosing Field Types for Style Mapping
.
3. Use the Number of buckets selector to indicate how to group the range of field values. This option is only available for
fields with numeric data. The ranges for each bucket are automatically computed but can be adjusted manually. See
Customizing the Value Range for Numeric Data
for details. To learn how buckets behave for string and numeric fields,
see
4. For each bucket defined, select an icon from the list.
5. Make any further desired adjustments:
❍
Subfolders - You can create subfolders for each icon bucket so that the Places listing displays the data
elements grouped by the folder label into their respective folders. This makes it easier for you to show or
hide the display of icon groups simply by selecting or removing the check box next to the folder. Once you
select the subfolder option, you must provide a name for your sub-folder in order for the data to be