Log tab – Ocean Optics OOISensors User Manual
Page 31
2: OOISensors Software
Option Name
Description
Spectral Graph & Time Chart: The Spectral Graph appears in the top
of the display window and the Time Chart appears in the bottom of the
display window.
To view a Temperature Chart, select Graph&Chart | View Temperature
Chart from the menu bar. The Temperature Chart will replace the
Spectral Graph until View Temperature Chart is unchecked.
Temperature Units
Specifies the format for temperature display. Select Celsius or
Fahrenheit from the drop-down menu.
Note: OOISensors measures all temperatures in Kelvin and converts to
Celsius or Fahrenheit.
Color for overlaid spectra
Specifies colors for static spectra opened with the File | Open
Spectrum command from the menu bar. Stored static spectra are
displayed as overlays, and you should distinguish overlays from real-
time spectra by modifying the color of the traces.
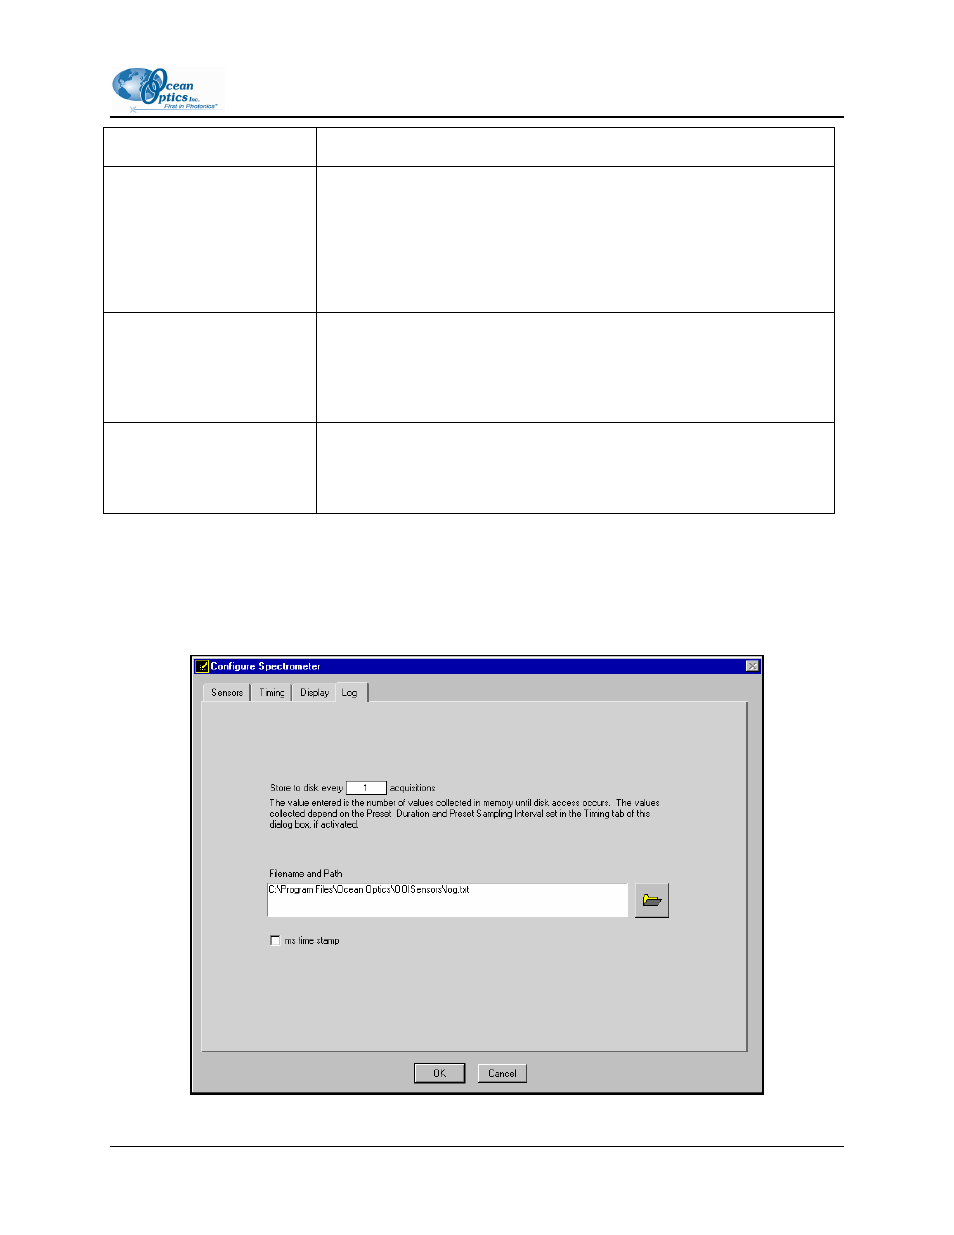
Log Tab
Click on the Log Tab in the Configure Spectrometer screen to access data logging controls. These
controls allow you to configure the data logging parameters available in OOISensors.
FOXY-AL300-000-02-0207
21