3 graph labels, Table 39 edit style dialog box – ZyXEL Communications NetAtlas Workgroup User Manual
Page 86
NetAtlas Workgroup Ethernet Switch Manager User’s Guide
Chapter 8 Performance
86
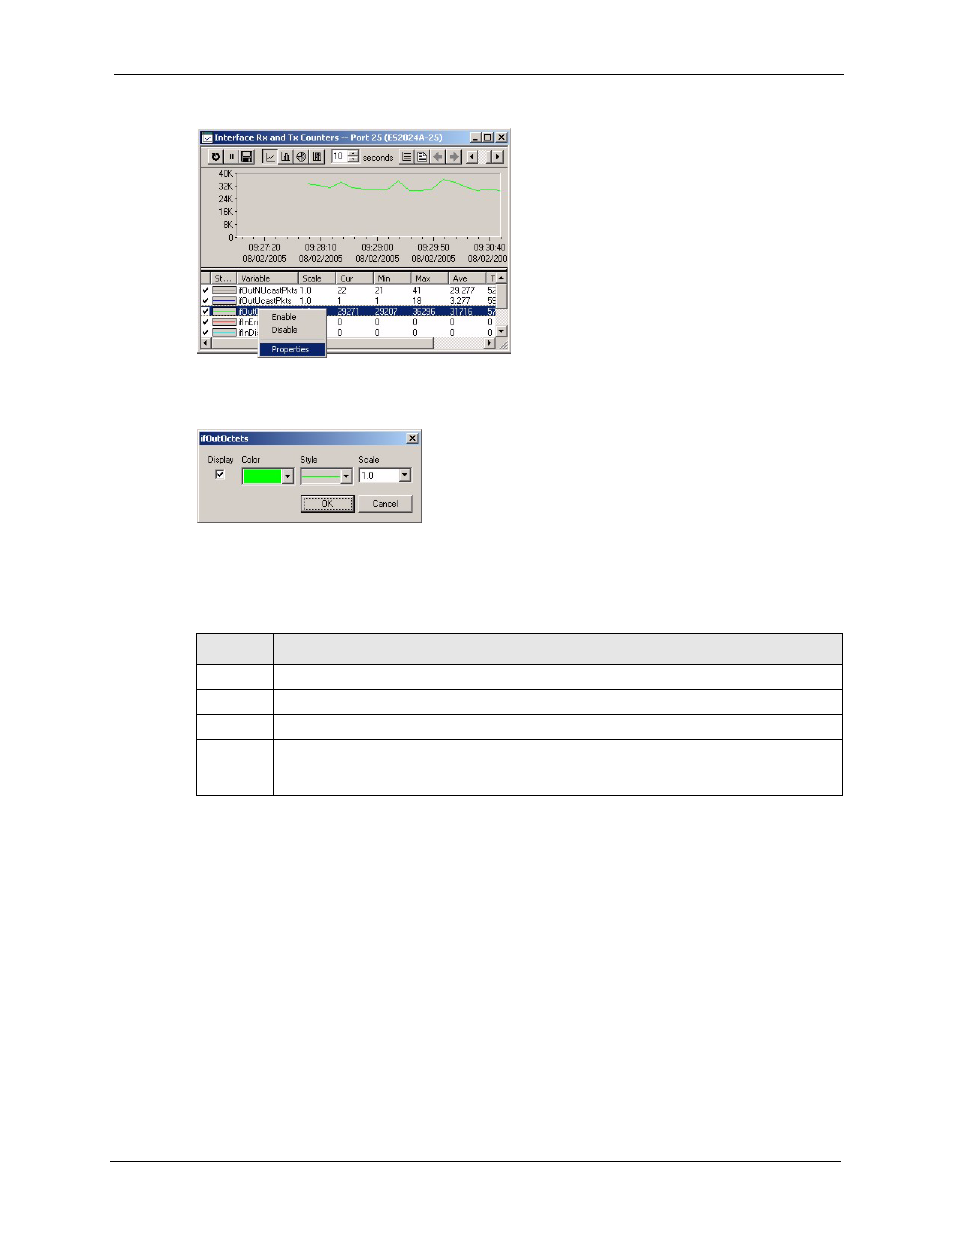
Figure 49 Cell Properties Select
4 A display properties dialog box opens. Select the Display check box.
Figure 50 Chart Color Codes and Line Styles
You may also edit the color code and line style for a variable in the dialog box as described in
the following table.
8.3.3 Graph Labels
In the Interface screen click the Graph button to display the following screen.
Table 39 Edit Style Dialog Box
FIELD
DESCRIPTION
Display
Check Display to view information about this variable in chart format.
Color
Choose a color from this drop down list.
Style
Choose a line style from this drop down list.
Scale
Select the scaling multiplier from this drop down list. This factor is applied to each value in
the line before it is displayed and can be used to keep all graph lines within a similar range
of values. The range is from 0.0001 to 1000.0.
- ZyXEL Dimension GS-1116A (30 pages)
- ZyXEL Dimension ES-2108PWR (4 pages)
- DIMENSION ES-4024 (4 pages)
- MI-7526F (6 pages)
- ZyXEL Dimension ES-2048 (306 pages)
- DIMENSION ES-1016A (2 pages)
- ONU-6040B-21 (19 pages)
- HOMEBOUND TRIPLE PLAY DELIVERY ES-315-F (2 pages)
- IES-708-22 (6 pages)
- Version 1.03 (242 pages)
- ZyXEL Dimension ES-1552 (43 pages)
- ES-2108 (224 pages)
- ZyXEL Dimension ES-1124 (48 pages)
- 2-Slot 10GBase-CX4 10Gigabit Module EM-412 (18 pages)
- GS-105B/108B (48 pages)
- ES-4024A (128 pages)
- ETHERNET SWITCHES ES-1016 (2 pages)
- GS-4012F/4024 (363 pages)
- ZyXEL Dimension ES-2024 (195 pages)
- ZyXEL Dimension ES-2108 (277 pages)
- ZyXEL Dimension GS-3012F (237 pages)
- VES-1000 (155 pages)
- PoE-80 (23 pages)
- ES-1124 (30 pages)
- 4500 Series (7 pages)
- ES-3148 Series (362 pages)
- GS-3012F Series (300 pages)
- Ethernet-to-Fiber Media Converter MC1000-SFP-FP (34 pages)
- GS2200-24P (4 pages)
- ES-105A/108A (2 pages)
- ZyXEL Dimension GS-1016 (32 pages)
- EES-1024AF (99 pages)
- GS-4012 (462 pages)
- IES-6000 (100 pages)
- ES-315 (166 pages)
- ES-2108 Series (283 pages)
- ZyXEL Dimension ES-2024PWR (286 pages)
- GS-3012F/3012 (314 pages)
- GS-108B (48 pages)
- GS-105 (7 pages)
- GS-4012F (462 pages)
- VES-1616 (118 pages)
- A-6000 (23 pages)
- LAYER 3 ES-3124 (337 pages)
- GS-105A (2 pages)