Displaying 24-hour performance data bar charts – Verilink Access Manager 2000 (896-502037-001) Product Manual User Manual
Page 303
Displaying 24-Hour Performance Data Bar Charts
Access Manager 2000 User Manual
8-33
You can view the last 96 15-minute intervals. The 24-hour summary is
always shown in the last row.
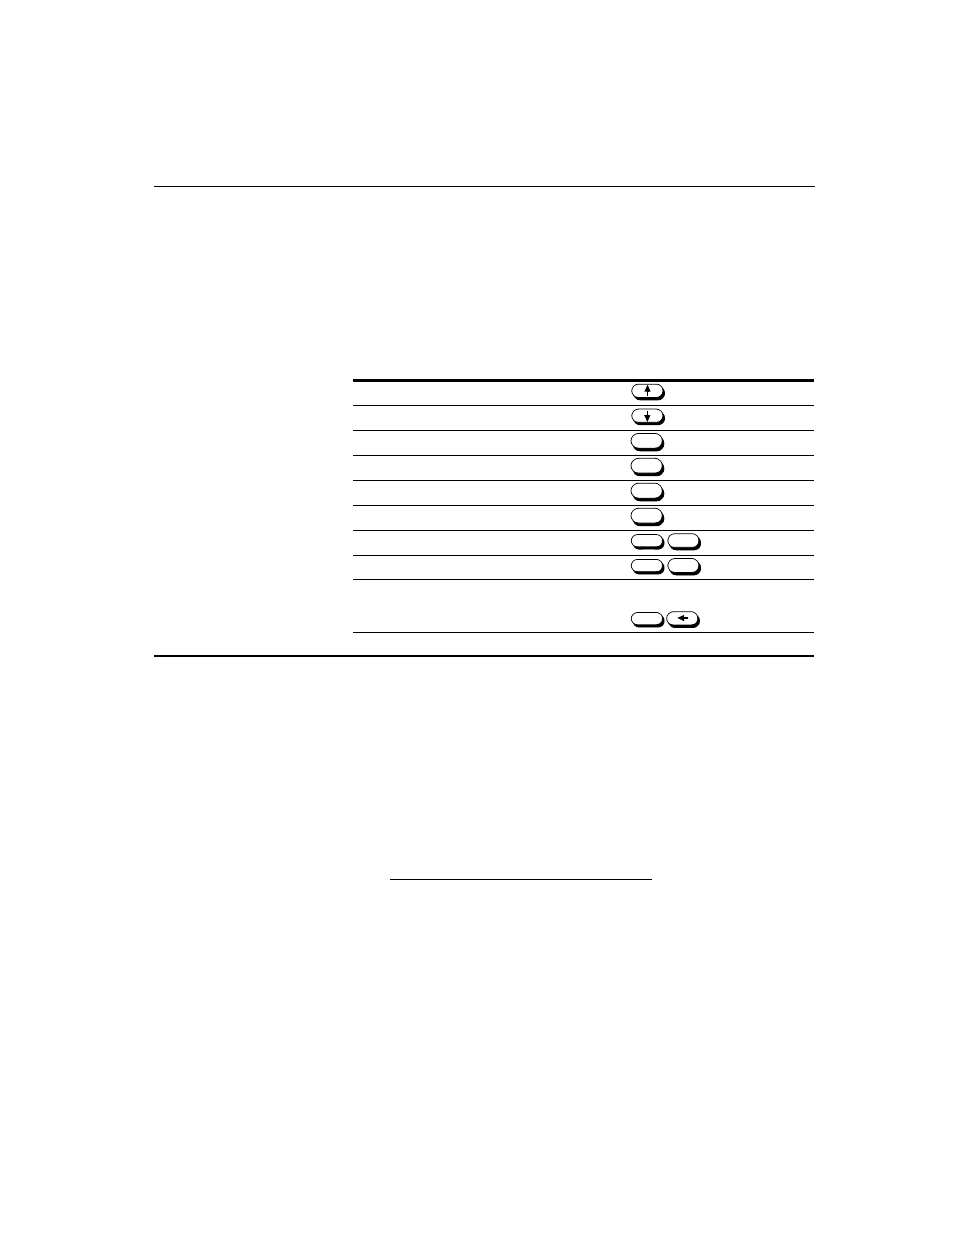
Getting around in the screens
Use the following keystrokes to “travel” between screens.
Displaying 24-Hour Performance Data Bar Charts
The bar charts displayed and printed through this option graphically
display the performance data registers for the past 24 hours of each
register type.
To access bar charts:
1. When you get the On-line Access sub-menu, select a bar chart as
follows:
If you are examining a 551VST type CSU, select
Bar chart
User
or
IXC/TELCO Bar Chart
.
•
User performance data includes the ES, UAS, BES, SES, LOFC,
ES-L, and SEFS registers.
•
IXC/Telco performance data includes the ES, BES, UAS, SES,
and LOFC registers.
To do this:
Use these keystrokes:
Scroll up, one row at a time
Scroll down, one row at a time
Go to the beginning
Go to the en
Go to the next page of data in this screen
Go to the previous page of data in this screen
Access the previous CSU in the selected range
Access the next CSU in the selected range
Display the registers of a CSU at the far-end of
the ESF Facility Data Link
First, access the corresponding
near-end CSU, then press
Home
End
PgUp
PgDn
Ctrl
PgUp
Ctrl
PgDn
Ctrl